One of my goals for the summer is to practice my R skills using data provided by the R for Data Science Tidy Tuesday Project 1. A data set is posted on the Tidy Tuesday github repository every week, and the goal is to wrangle and vizualize the data and share your plots on twitter using #TidyTuesday. I was inspired by Smith College Alumna Sara A. Stoudt (@sastoudt on twitter), who is currently persuing a Ph.D. in statistics, to learn R blogdown and write a blog about my weekly Tidy Tuesday projects! The link to her blog that I took inspiration from is here.
This week, for my first post, I will be using the data from the week 17 of 2020 (04-21-20) just to get started, and then from next week on I will use the new datasets corresponding to the current week.
This week’s dataset contains information about GDPR violations in the EU. Data privacy has recently become an increasingly important issue as technology has allowed for companies to easily collect data about their users. In order to crack down on privacy violations, the EU enacted the General Data Protection Regulation (GDPR) in May 2018. The policy outlines a set of regulations that all companies who serve clients in the EU must comply with in order to protect the privacy of their customers. More information about the policy can be found here 2. If a company fails to meet the regulations, they are issued a fine. Data about the nature of the fines over the past two years since the enactment of the policy are in the gdpr_violations dataset. The source of the data is here 3.
GDPR Violations Over Time
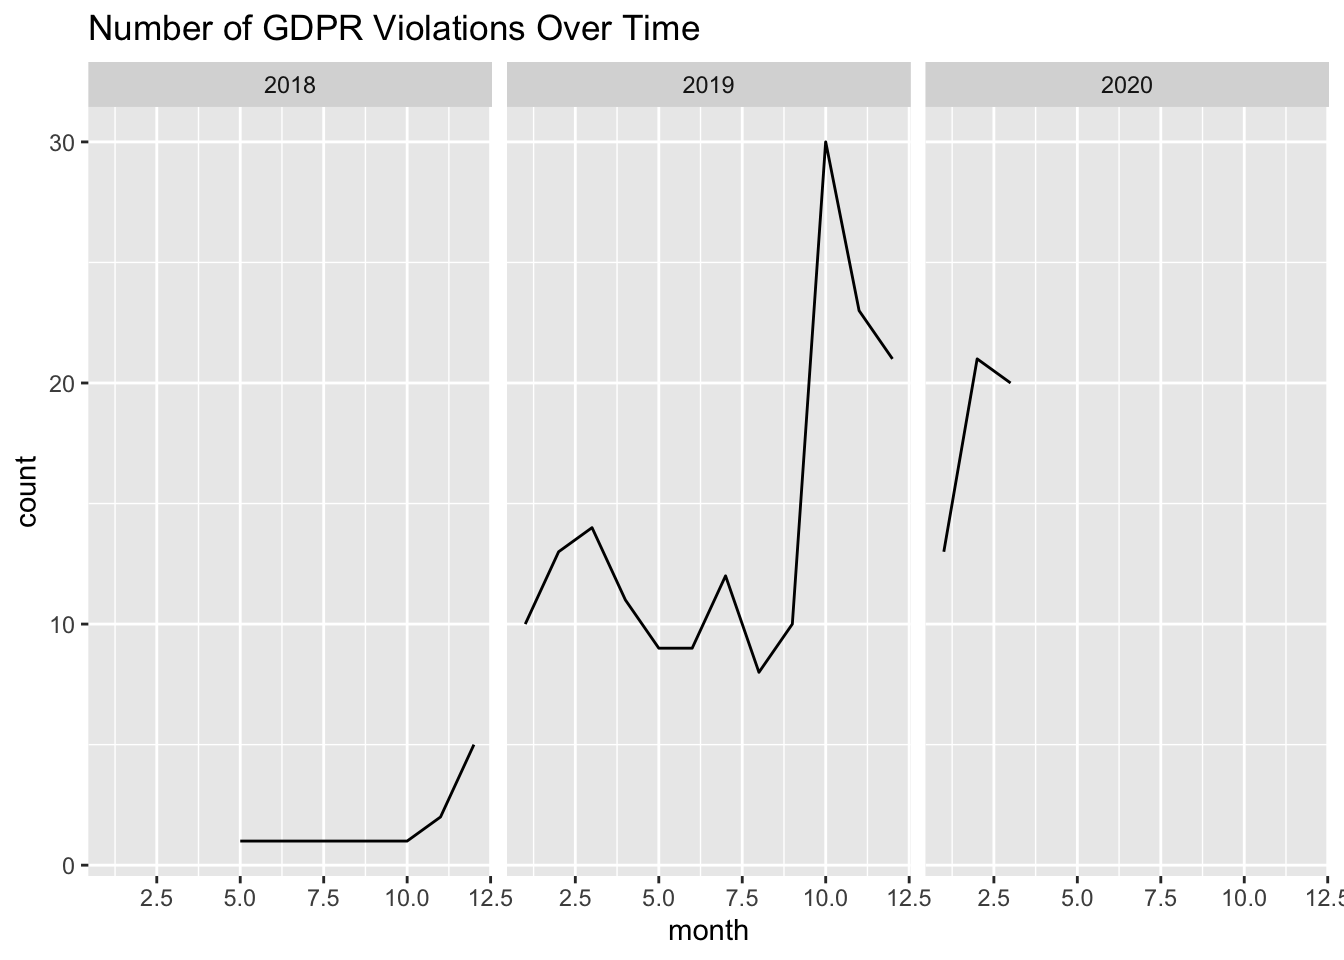
Based on this plot, it appears that when the policy was first implemented in May 2018, there were very few violations, but the number of violations started to grow quickly toward the end of 2018 onward. I would be curious about what initiated the extreme spike in violations around october 2019.
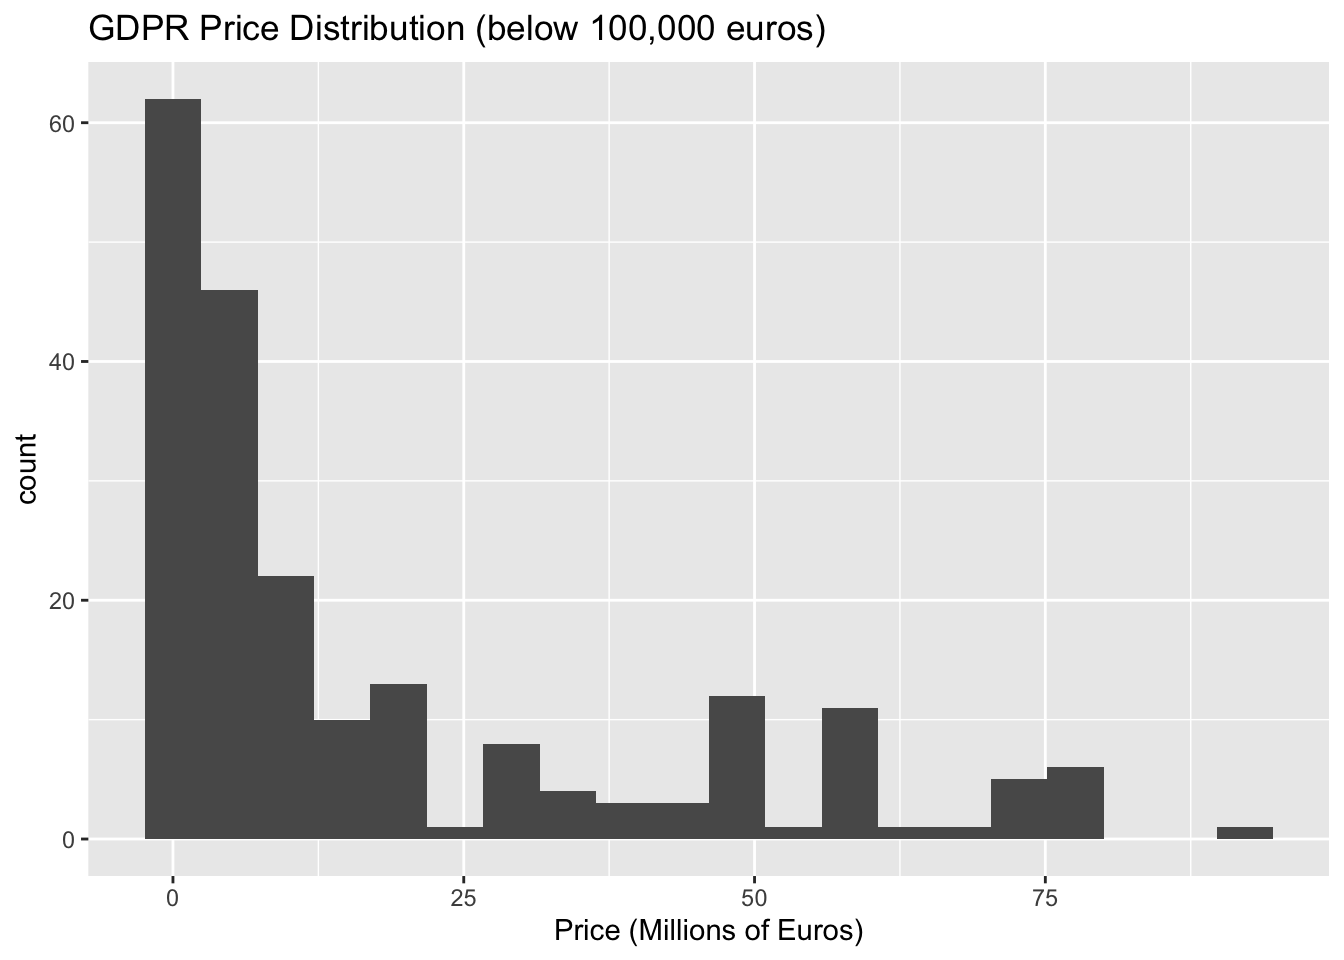
What is the cost of a GDPR Violation?

Based on this histogram, there was a very wide range of fines distributed for GDPR violations. The majority appear to be on the lower end of the spectrum, but fines up to 50,000,000 euros were issued.
Since there is such a large range of prices, but only a few fines are very high, I made another histogram below limiting it to the prices below 100,000 euros. This histogram shows the distribution of the majority of the prices more clearly. Even among just the lower prices, most prices seem to be below about 10,000 euros.
Top Countries
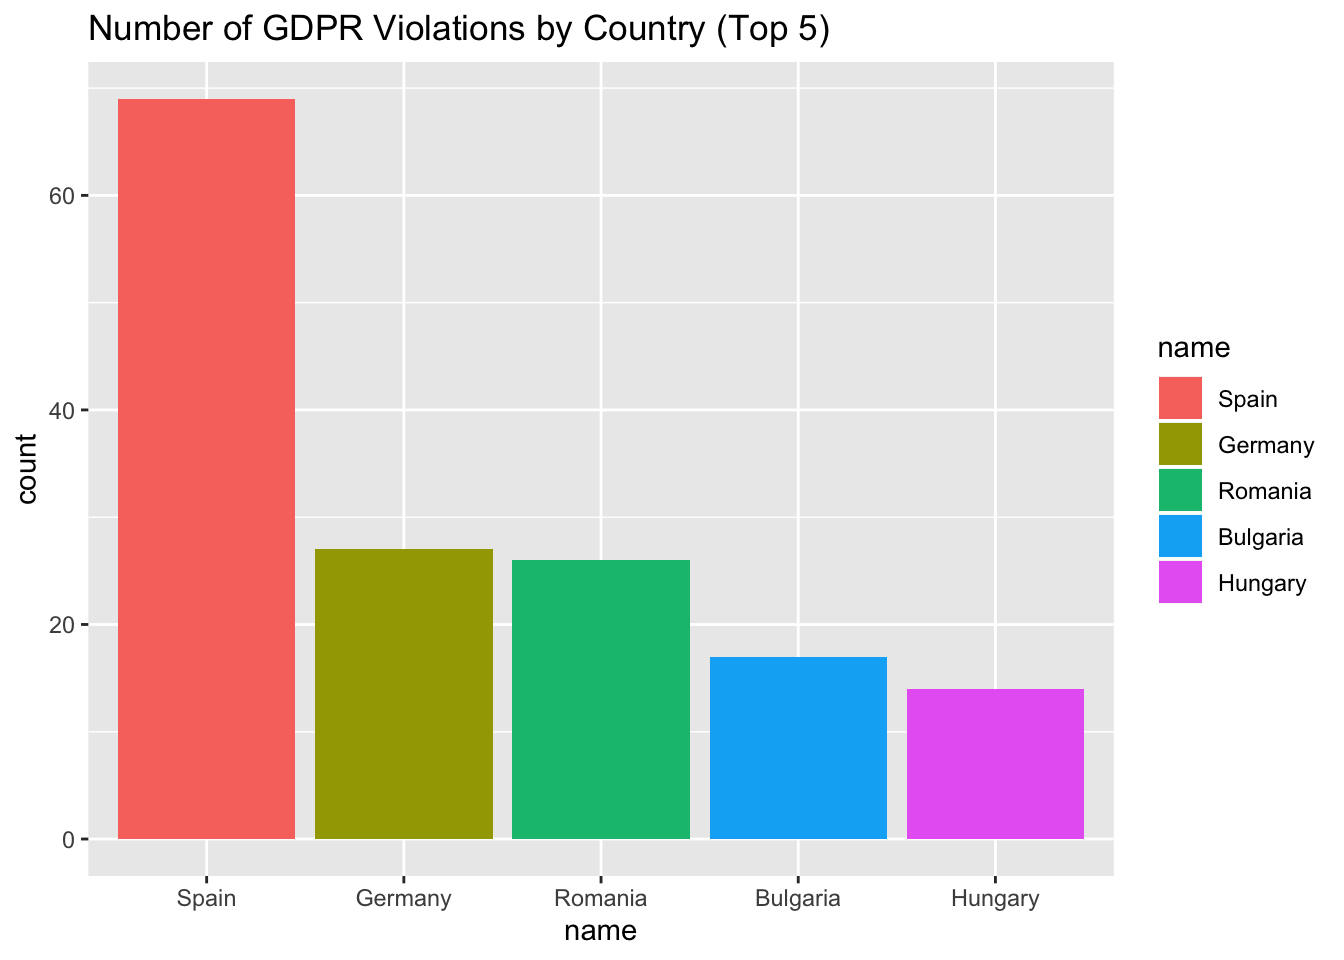
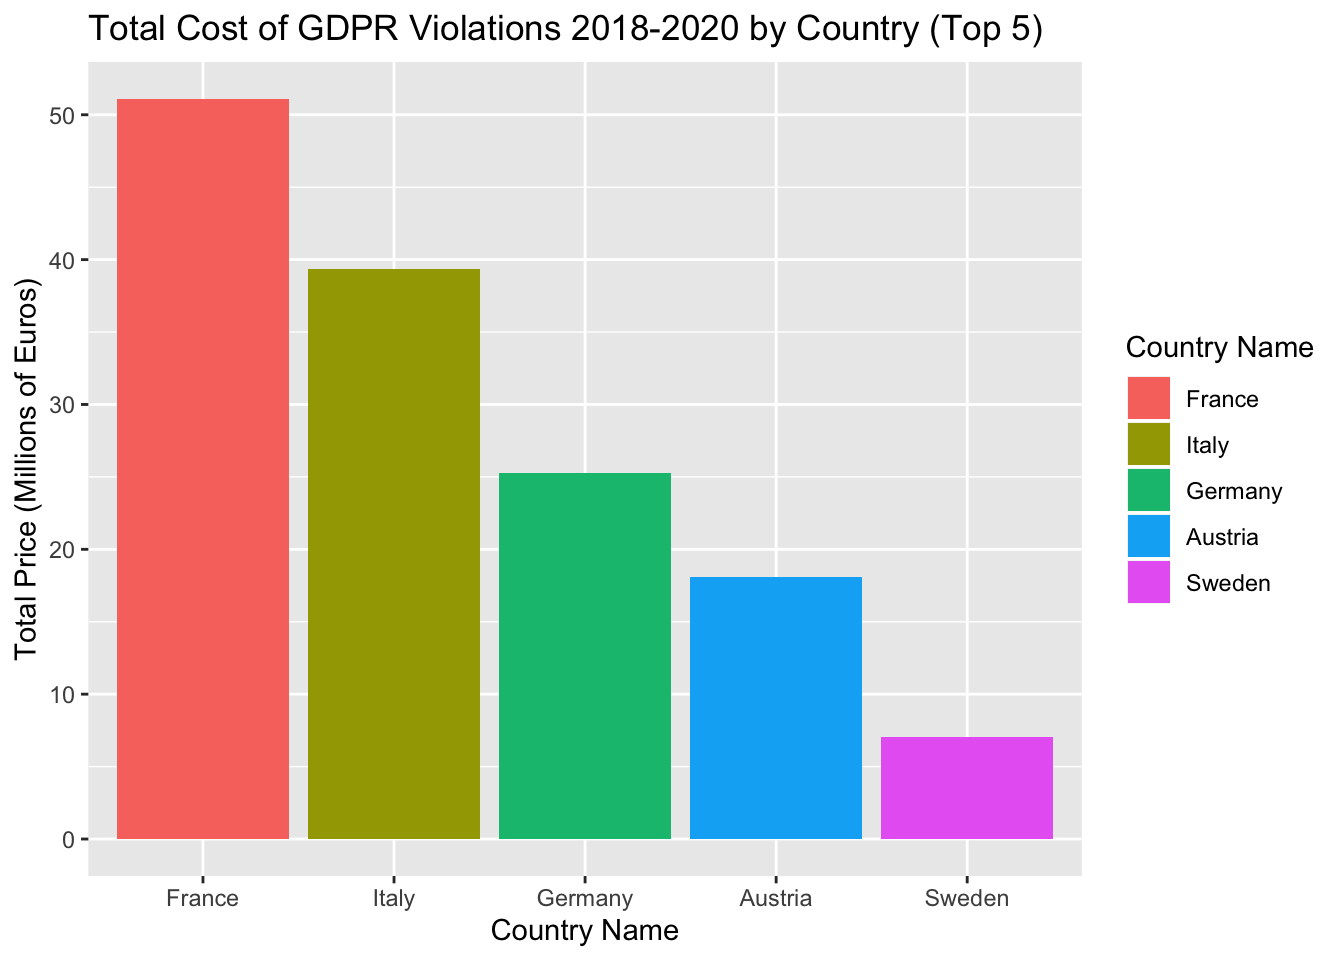
Surprisingly, the top 5 countries for number of violations does not align directly with the top 5 countries for total cost of GDPR violations over the period 2018-2020. For example, Spain has the highest number of violations by far, but is not even in the top 5 for total cost, so most of its violations must have been relatively small. On the other hand, France and Italy, the top two for total cost, did not even make the top 5 for number of violations.
Exploring this data made me curious to learn more about the impacts of the implementation of the GDPR policy. I would be curious to know how effective it is in comparison to U.S. data privacy laws, which I believe are much more lenient in terms of how companies can use customers’ data. Based on the fact that the number of violations has grown significantly since the policy was first implemented, and the majority of the fines issued seem to be relatively inexpensive, it seems that the consequences for companies of violating the GDPR may need to increase in order for the policy to be truly effective in protecting customers’ privacy. Of course, these visualizations do not by any means tell the whole story, and I would have to do more research to verify that conclusion.
Well, that’s it for my first post! Stay tuned for next time!
The code used to generate this post can be found here.