Animal Crossing is a Nintendo video game, and the latest version, Animal Crossing New Horizons, released on March 20th 2020 is the latest trend among gamers. It is an open-ended simulation game where the goal is to create a community of anthropomorphic animals on a deserted island. If you want to learn more about it, the wikipedia page is here 1.
The #TidyTuesday data this week contains information about Animal Crossing reviews by both critics and consumers 2 3. The data contains a numerical score associated with each review as well as the qualitative text review.
Trends in Reviews Over Time: Critics Versus Users
In order to see the overall trends in the reviews of critics versus users, I created a time series plot showing the trends over time in the average numerical ratings by critics and users (out of 10) since the game was released. The critics originally gave scores out of 100, but I converted them to be out of 10 for more consistent comparison to user reviews, which were out of 10.
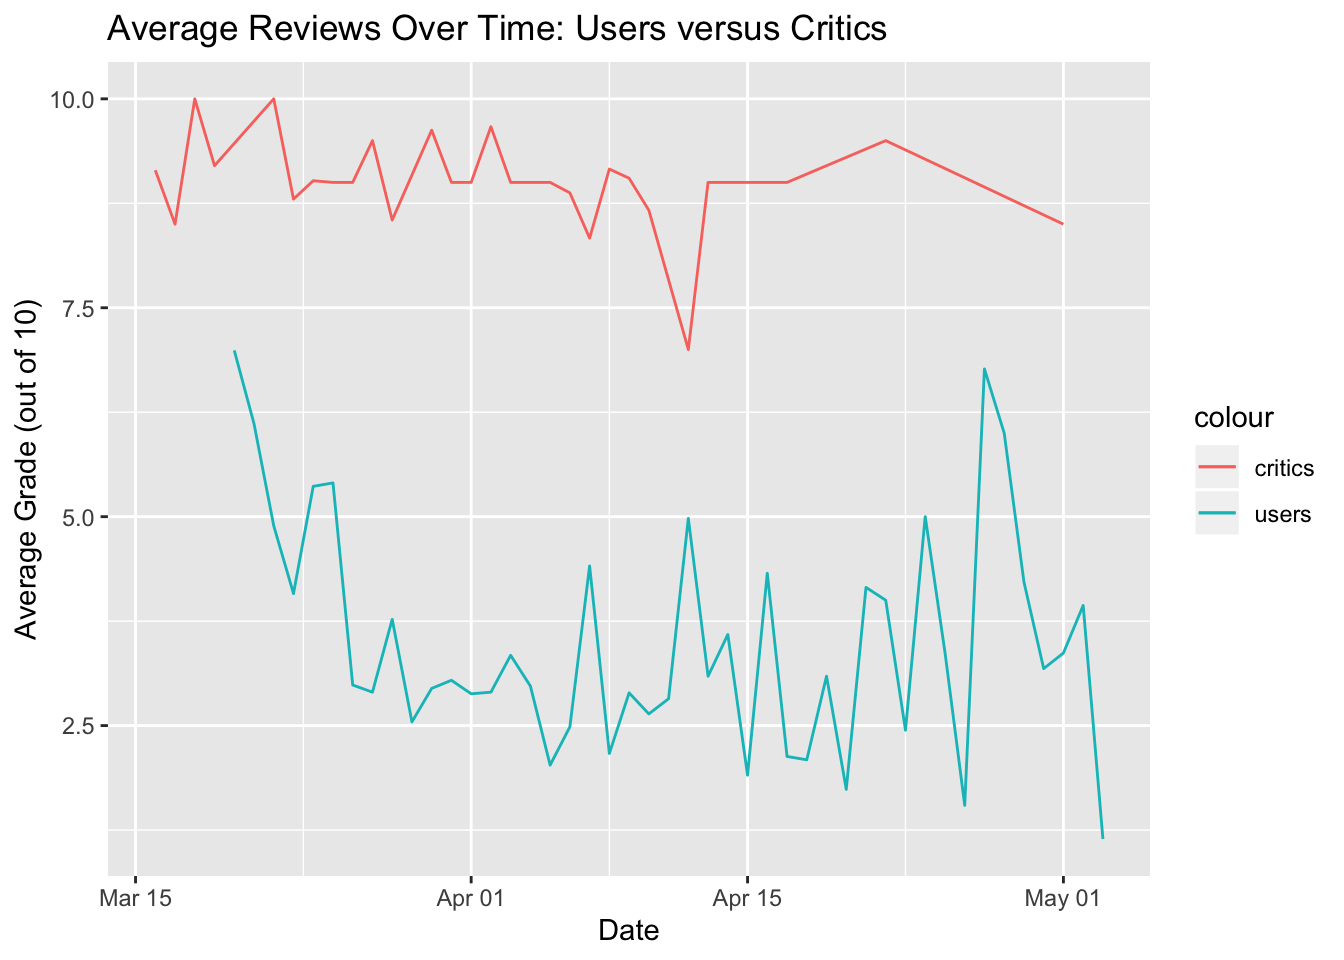
Surprisingly, given the enormous commercial success of the game, the reviews by critics appear to be significantly higher than the reviews by users. In this article, one critic, Jeff Grubb, offers some insight as to why users may be frustrated with certain aspects of the new game compared to older versions of the game 4. This could be partly why users rated the game so poorly, but it still does not fully explain why reviews by critics would be so significantly higher.
Furthermore, the user reviews have fluctuated but seem to have decreased overall since the release of the game, while reviews by critics have remained relatively consistent. This again raises the question of what is so different between a user’s experience of the game versus a critic’s experience.
Rating Distributions
In order to compare critic versus user reviews from a slightly different angle, I created boxplots representing the overall distributions of scores.
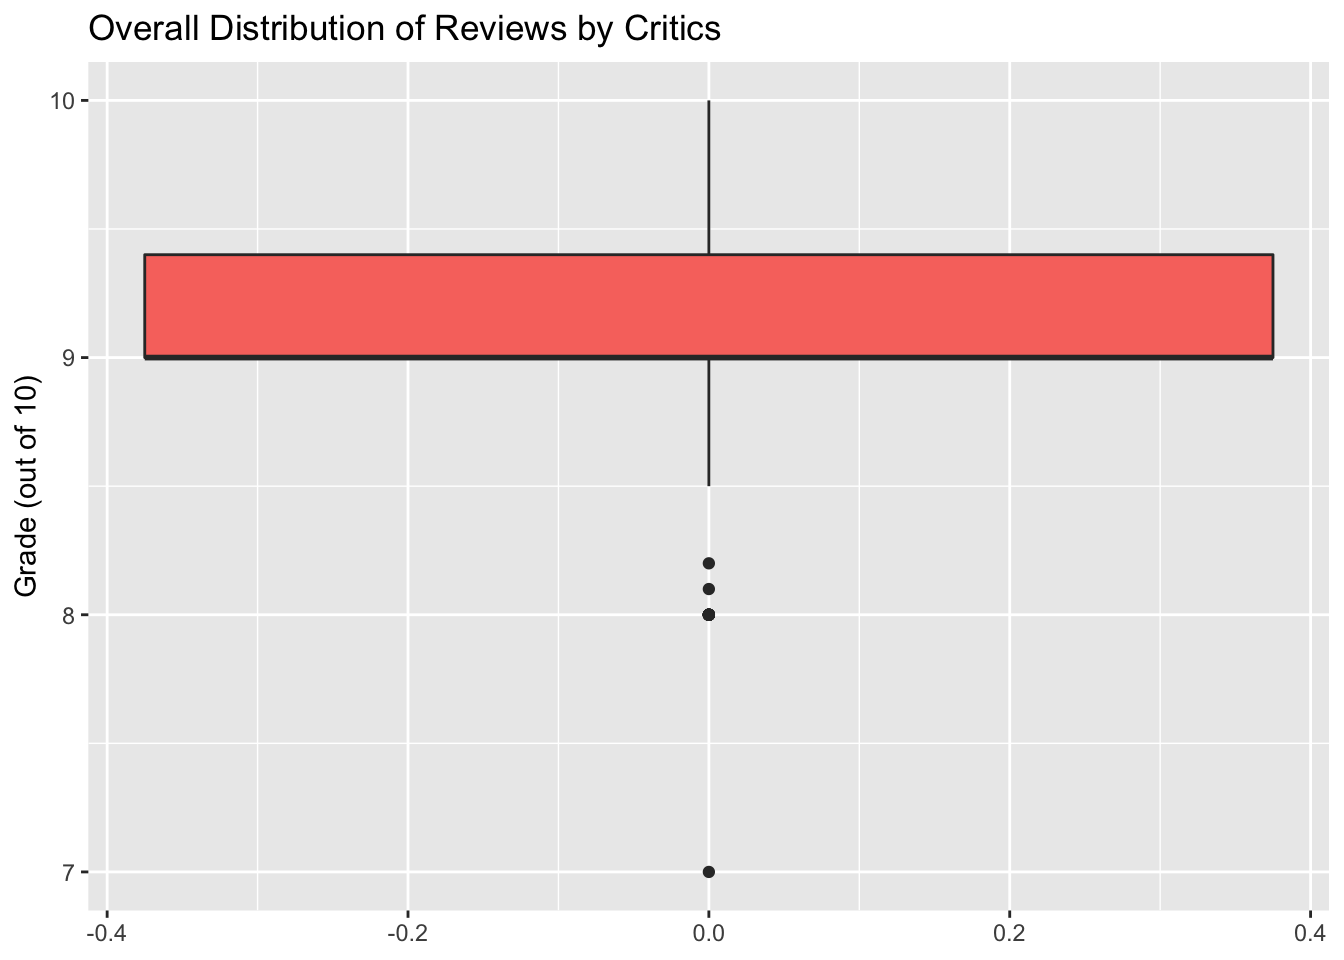
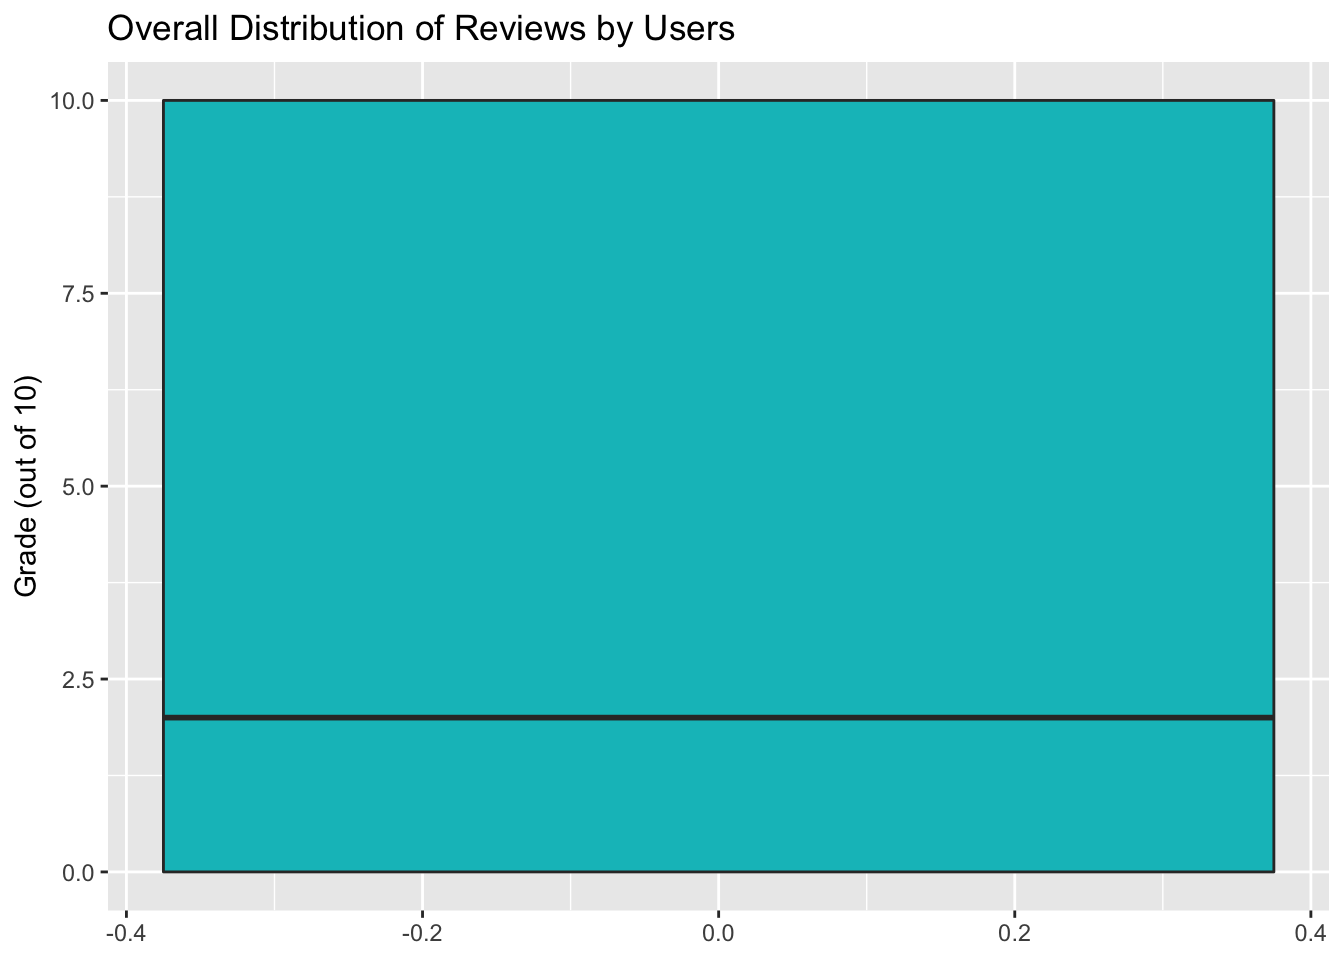
Consistent with the line graph, the median grade given by users appears to be almost 7 points lower than that given by critics, and this is an enormous difference on a 10 point scale! Furthermore, the scores given by users were much more widely spread out than those given by critics. This aspect makes sense given that critics generally approach their reviews with set criteria that is somewhat accepted among critics, so they are likely to reach similar conclusions, whereas users are reviewing the game based on their own very different priorities and preferences.
Another notable aspect of these plots is that the plot of users’ scores has no “whiskers” or outliers, indicating that the minimum score (0) is also the first quartile, and the maximum score (10) is also the third quartile. This likely reflects the fact that users are more likely to review something if they have a strong (positive or negative) opinion about it, so a substantial number of users rated the game a 0 out of 10, but a substantial number also rated the game a 10 out of 10. This effect would not apply to critics because critics are asked by companies to review certain games– they do not choose which games to review based on how much they like the games. This could be a possible explanation of the large disparity between user reviews and critic reviews. In general, users are more likely to review a product if they have a strong opinion about it at either extreme, but they may be even more inclined to review the game if their strong opinion is negative. If this is the case, the user reviews may not provide an accurate representation of overall user satisfaction.
On the other hand, I am not an expert on how video game criticism works, but I believe critics are paid by the distributer of the game to review it. Thus, it seems that they may be more inclined to give a positive review so that they have a higher chance of being hired again by the same distributer. In this case, critic reviews may also be a misleading measure of the overall quality of the game.
So, is Animal Crossing New Horizons worth buying? According to wikipedia, the game broke the console game record for most digital units sold in a month, having sold 5 million digital copies within the first month of being released 5. Plus, the median review by critics is a 9/10, which is pretty darn good. Based on these numbers, the verdict seems like a no brainer. The one piece of the puzzle that doesn’t fit is that the median user review is less than a 2.5 out of 10. Based, on that number alone, it would seem obvious that the game was terrible! I have explored some possible reasoning for this seemingly paradoxical disparity, but the definitive reason is still a mystery.
Text Analysis
In addition to looking at the numerical scores given by users and critics, I decided to do some qualitative text analysis to dig deeper into the differences between critic and user sentiments about the game. This was my first time doing text analysis in R, so it was a fun new challenge for me! The Text Mining with R book was a very helpful resource to get me started 6.
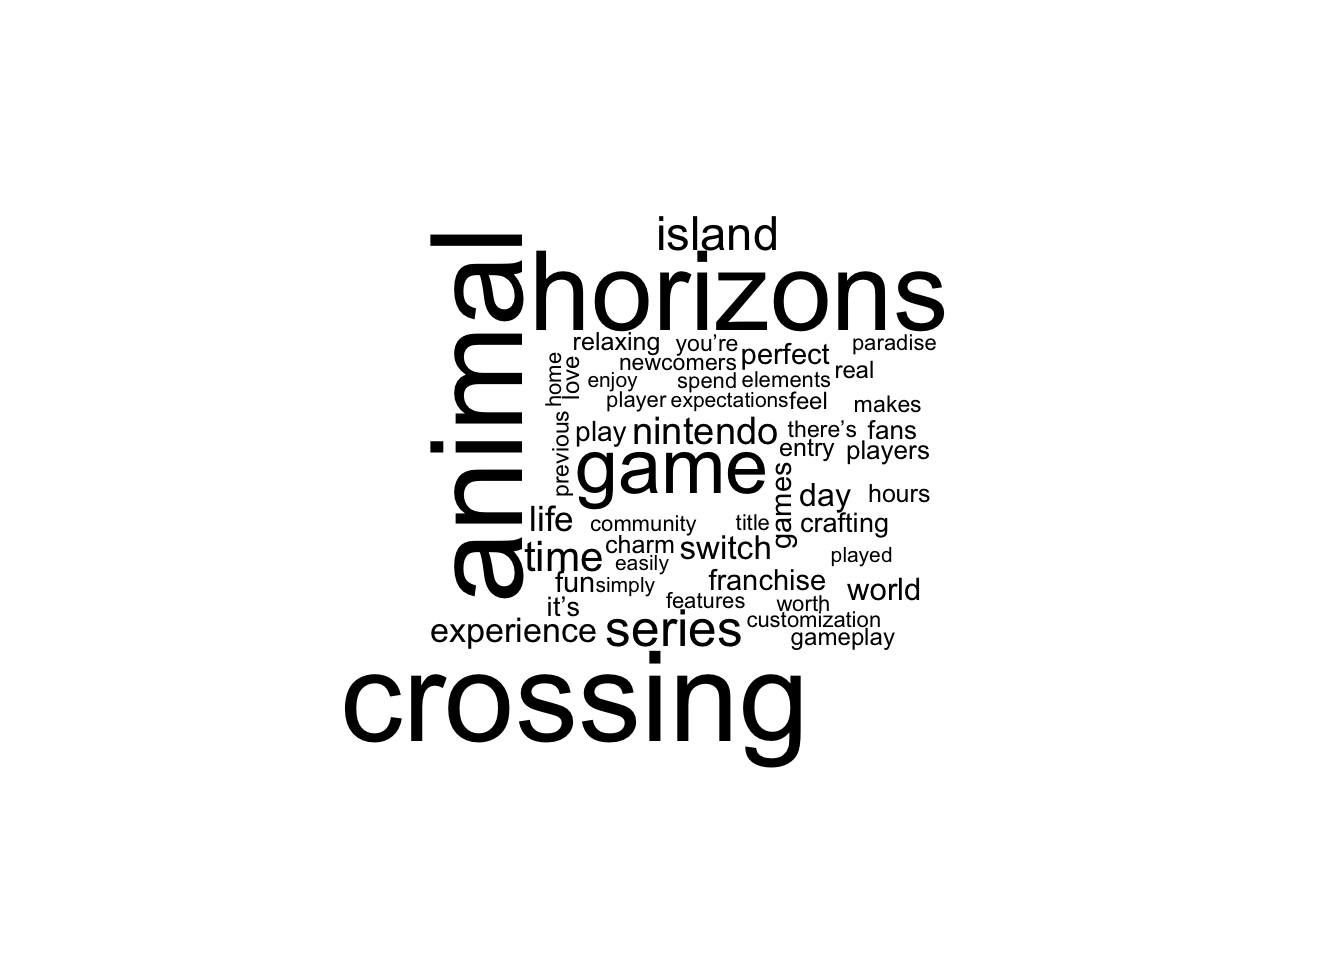
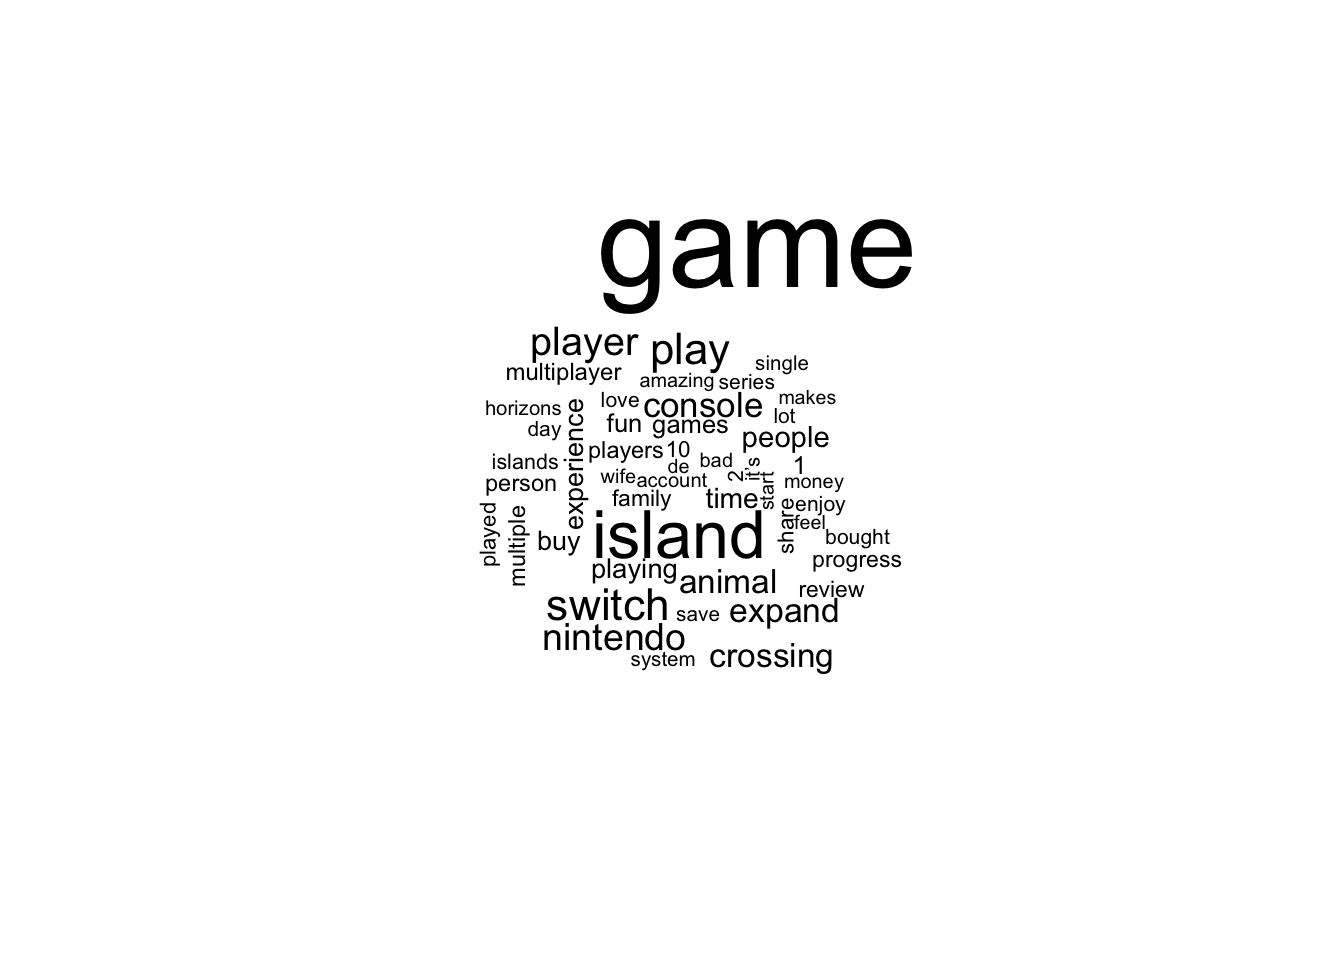
First, just for fun, I created word clouds of the most commonly used words in the critic and user reviews (I limited it to the top 50 words so they could all fit in the frame). This was not particularly informative because the most common words were pretty similar between the two, and the ones that stand out the most, like “animal”, “crossing”, “game”, “island”, and “nintendo” don’t tell us a whole lot about the opinions expressed in the reviews. Most of the words that are associated with emotion are positive for both, but it is notable that the word “bad” is in the top 50 most used words for users, while there are no explicitly negative words in the top 50 for critics.
Critic Reviews
User Reviews
In order to dig deeper into the differences in sentiments being expressed in critic versus user reviews, I used the nrc data set from the textdata package7, which is a crowd-sourced data set that classifies almost every word in the english language based on 10 sentiments: positive, negative, trust, anticipation, joy, sadness, fear, anger, surprise, and disgust. I joined this dataset with the data sets containing the words from the user and critic reviews in order to classify each word in the reviews based on these sentiments. Then, I computed the proportion of words associated with each sentiment for critic and user reviews, and compared the proportions using the bar plot below.
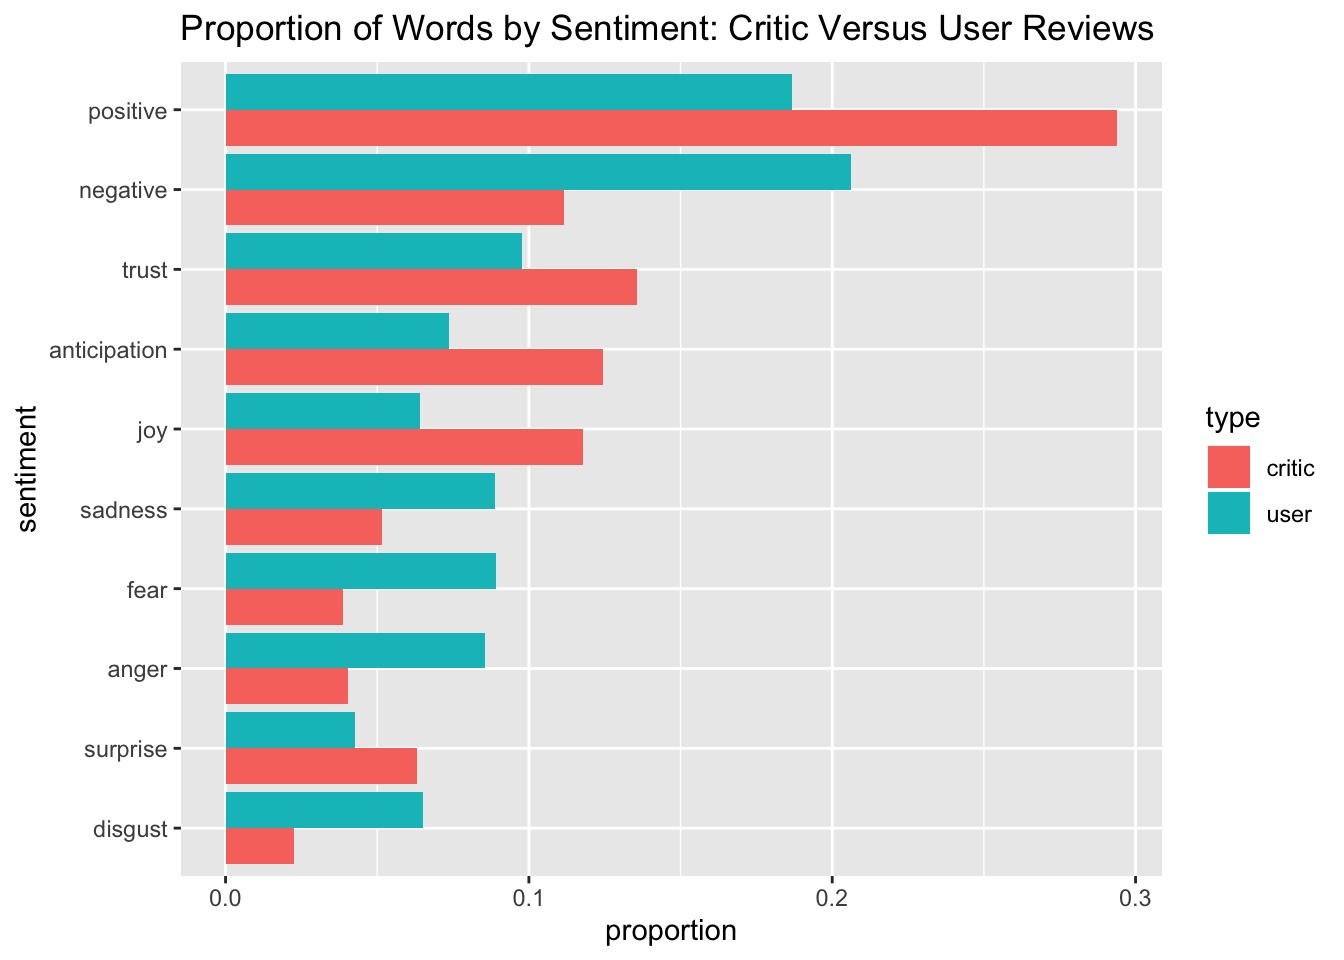
Consistent with the numerical scores being significantly higher for critic reviews, a significantly higher proportion of words in the critic reviews were classified into the categories positive, trust, anticipation, joy and surprise when compared to user reviews. Each of these categories corresponds to the expression of optimism, which makes sense because the numerical scores showed the critic reviews to be much more optimistic than the user reviews. On the other side of it, the proportions for critic reviews were much lower in the negative, sadness, fear, anger, and disgust categories compared to the proportions for user reviews. Each of these categories corresponds to the expression of pessimism, which also aligns with my analysis of the numerical scores.
Overall, it still puzzles me why the critics and the users would have such drastically different opinions on the same game, but it is clear based on both the quantitative analysis of the scores and the qualitative analysis of the text reviews that critics expressed much higher levels of satisfaction than did users about Nintendo’s new release Animal Crossing New Horizons. I will have to do more research on the game and on the process of video game review to better explain these results.
That’s it for this post! Stay tuned for next week!
The code used to generate this post is here.
https://en.wikipedia.org/wiki/Animal_Crossing:_New_Horizons↩
https://github.com/rfordatascience/tidytuesday/blob/master/data/2020/2020-05-05/readme.md↩
https://venturebeat.com/2020/04/15/6-weeks-with-animal-crossing-new-horizons-reveals-many-frustrations/↩
https://en.wikipedia.org/wiki/Animal_Crossing:_New_Horizons↩
This dataset was published in Saif M. Mohammad and Peter Turney. (2013), ``Crowdsourcing a Word-Emotion Association Lexicon.’’ Computational Intelligence, 29(3): 436-465.↩