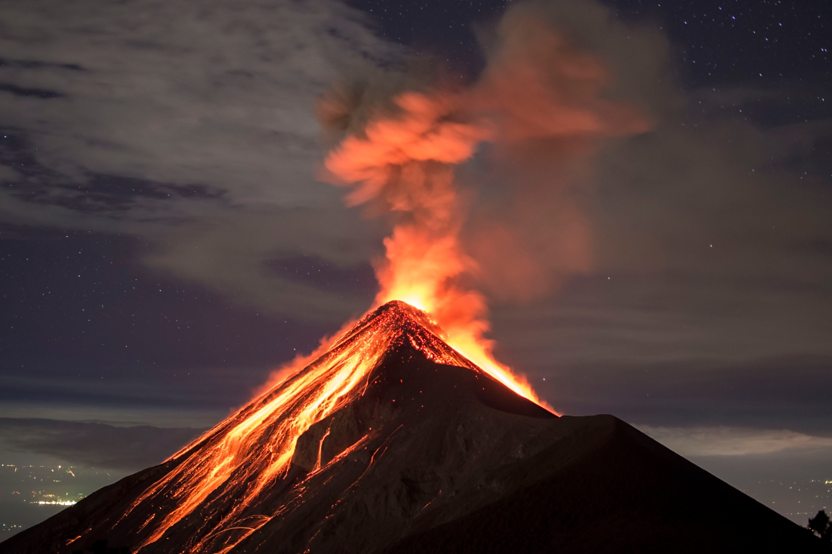
Volcanic eruptions are incredible geological phenomena, but they can also cause significant damage to the environment and surrounding populations. According to wikipedia, a volcanic eruption occurs when a crack in Earth’s crust allows hot lava, volcanic ash, and gases to escape from below the surface 2.
This week the #TidyTuesday data includes information about volcanic eruptions over time including the names of the volcanos, the dates of all eruptions between 11345 B.C.E and 2020 C.E., the location of each eruption, the type of each volcano, the elevation of each volcano, the population within 10, 30, and 100km of each volcano, the primary rock composition of each volcano, the degree of certainty that each eruption occurred, and more 3 4.
I used this data to create a fun shiny app where users can explore each of these variables in relation to volcanic eruptions over time using an interactive map 5.
This was my first shiny app, so it definitely involved a learning curve, but the Shiny from R Studio website was a very helpful resource to get me started 6 7. This blog post by Antoine Soetewey was very helpful in learning how to embed a shiny app into an R blogdown post.
I used the maps package8 and the ggmap package9 to create the world map.
Have fun and explore the app below!
The code used to create the shiny app is here.
The code used to generate this post is here.
References
https://github.com/rfordatascience/tidytuesday/blob/master/data/2020/2020-05-12/readme.md↩
https://shiny.rstudio.com/tutorial/written-tutorial/lesson1/↩
Original S code by Richard A. Becker, Allan R. Wilks. R version by Ray Brownrigg. Enhancements by Thomas P Minka and Alex Deckmyn. (2018). maps: Draw Geographical Maps. R package version 3.3.0. https://CRAN.R-project.org/package=maps↩
D. Kahle and H. Wickham. ggmap: Spatial Visualization with ggplot2. The R Journal, 5(1), 144-161. URL http://journal.r-project.org/archive/2013-1/kahle-wickham.pdf↩