Marble racing has become a recent trend. It involves dropping marbles into a track, and the marble that stays in the track the longest wins. When the marble goes into the track, it swirls around a structure shaped like a funnel, and then eventually drops through the hole of the funnel into another funnel and repeats the process through a series of funnels until it falls all the way out of the track. A quick video that will give you the general idea is here 2, and a slightly longer video that will give you a fuller understanding of how it works is here 3.
This week’s #TidyTuesday data contains data from YouTube videos of these races from the YouTube chanel “Jelle’s Marble Runs” 4 5. The data contains information about the times, track lengths, team names, marble names, whether or not the team was the “host” of the race, dates, and more for several marble races. At first thought, one would think that which marble wins a marble race would be completely random. However, this blogpost 6 by Randy Olson shows that particular marbles are actually more likely to win than others, suggesting that there may be some sort of strategy involved such as the angle at which the marble is dropped and the initial speed of the marble.
What is the goal in a marble race?
To illustrate the basic objectives when racing marbles, I have created a few scatterplots below showing the relationships between various variables present in the data set.
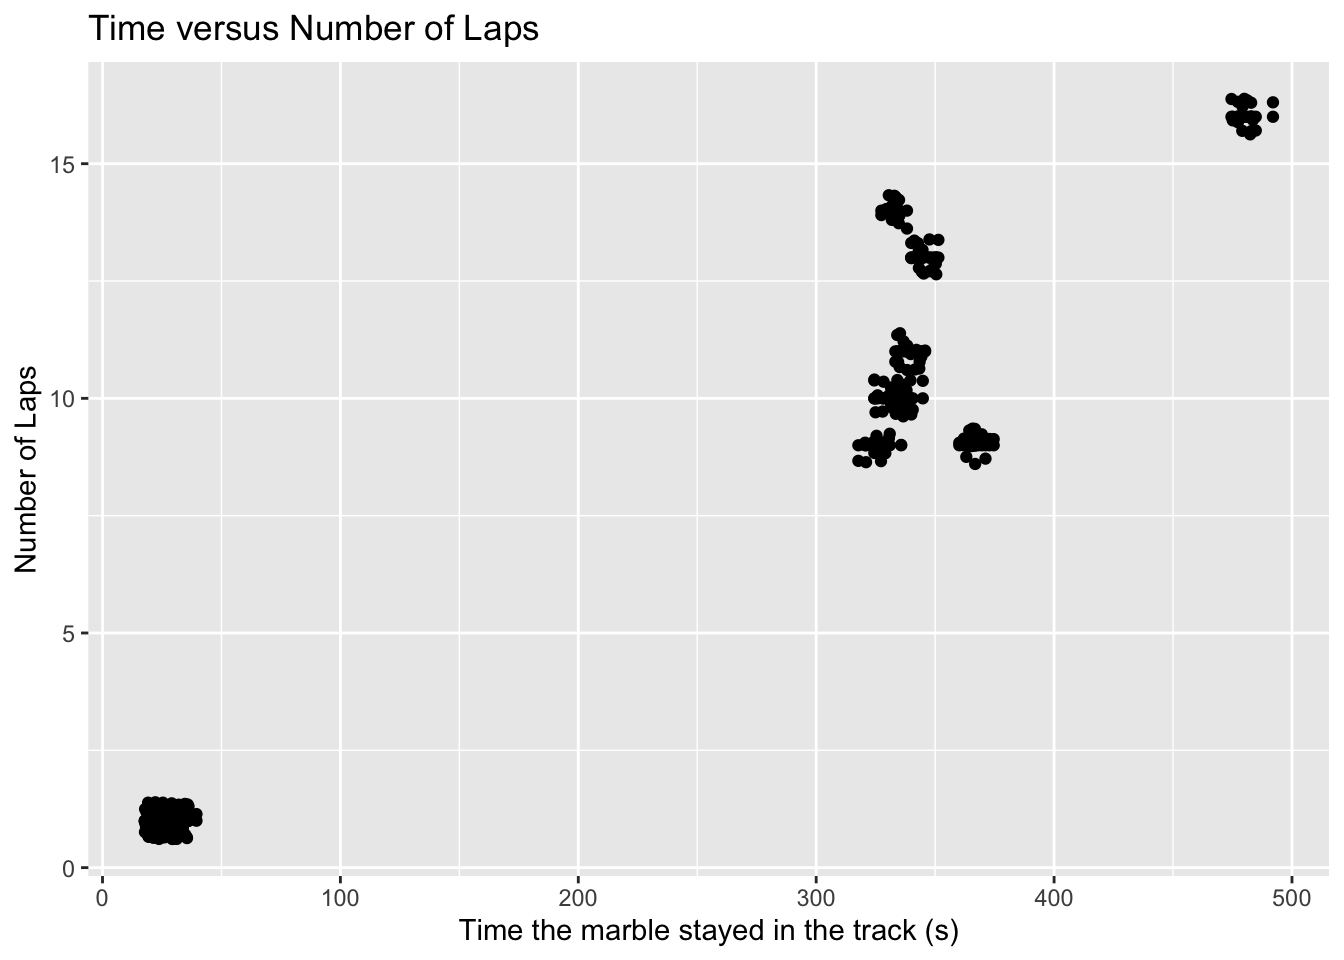
The first plot (below) shows the clear positive relationship between the overall time the marbles stays in the track and number of laps the marble completes.The longer the marble stays in the track, the better, and in order to stay in the track longer, the marble must do more laps.
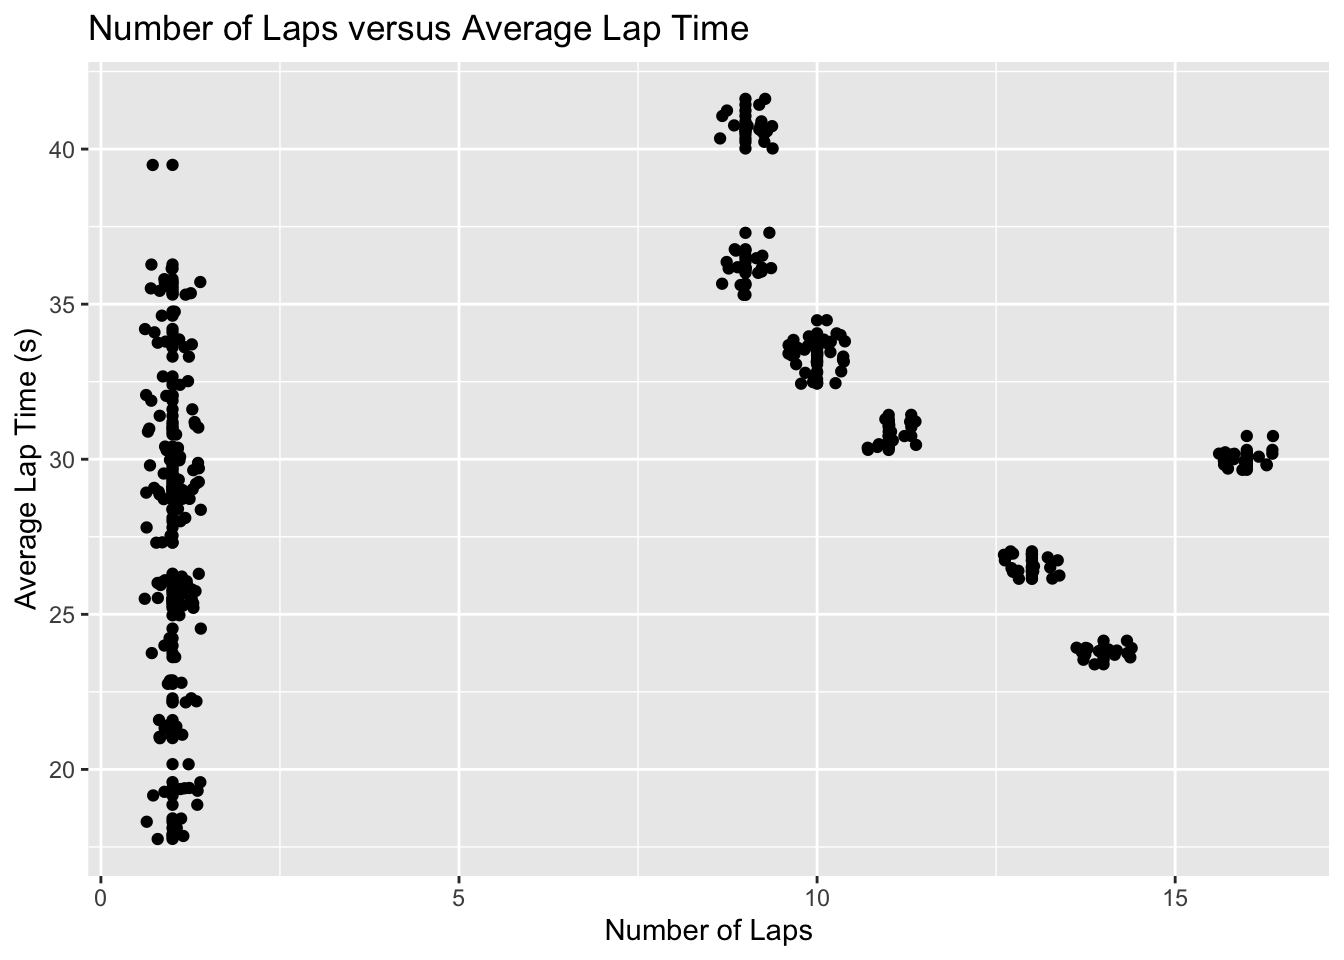
The second scatterplot (below) shows the relationship between the number of laps and the average time it takes for a marble to complete one lap. With the exception of cases where there was only one lap, which have a lot of variability, we see a clear negative relationship, indicating that the more laps a marble does, the faster each lap is on average. This makes logical sense because in order to do more laps, the average time of a lap needs to be faster in order to maintain momentum.
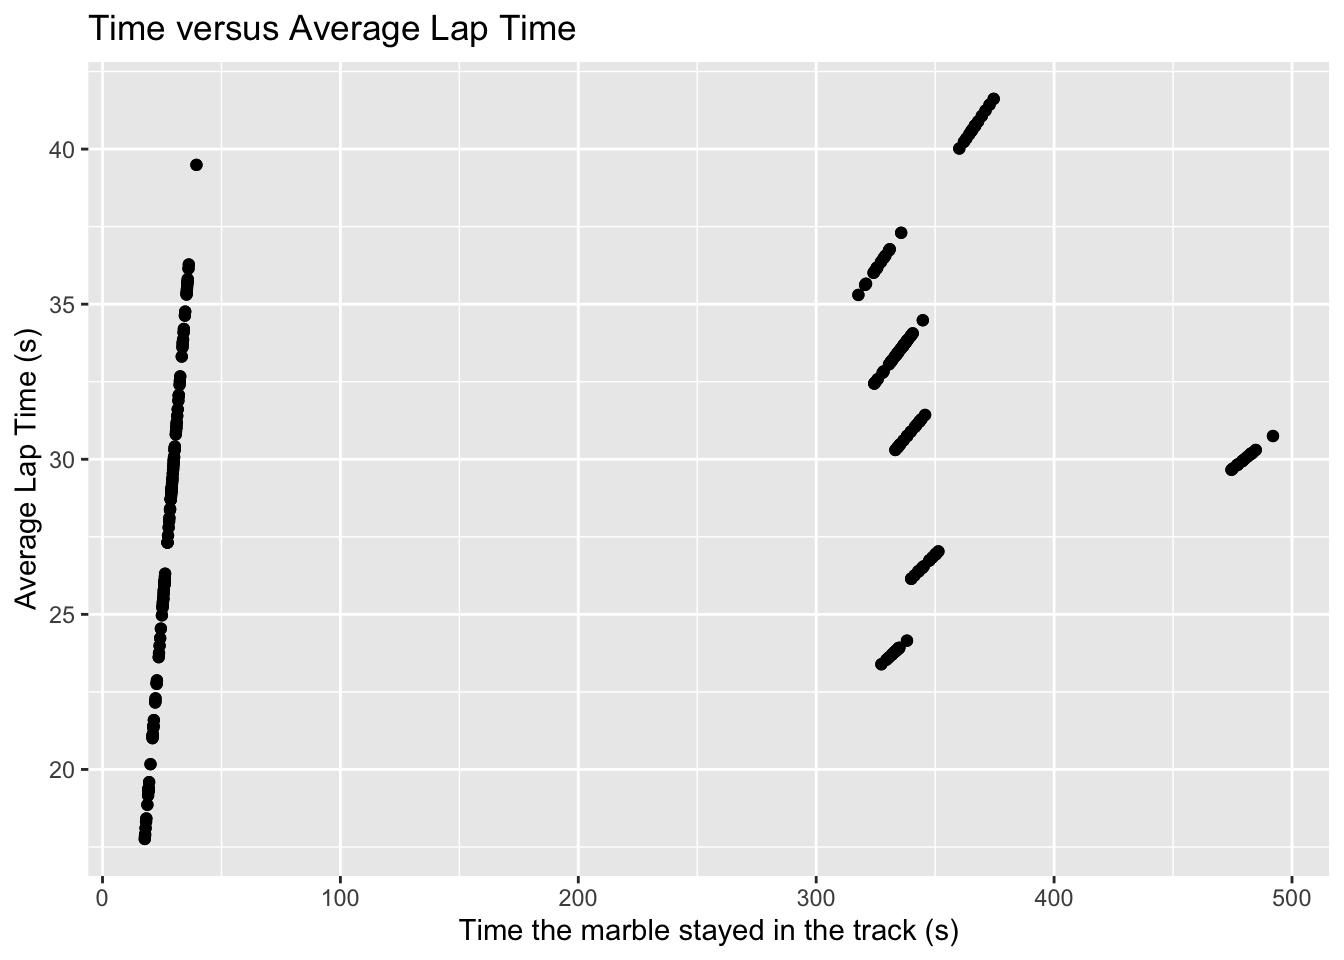
The relationship between the overall time and the average time of a lap is a bit tricky. If as the overall time increases, the number of laps increase (shown in the first plot), and as the number of laps increase, the average time of a lap decreases (shown in the second plot), it would follow by logic that as the overall time increases, the average lap time would decrease, right? However, we are seeing just the opposite in the graph below. It gets confusing because it makes sense in a way that if the overall time is longer, the time of a lap would be longer, but the opposite also makes sense– that in order to stay in the track longer, the marble would need to be doing laps at a faster pace. There may be other factors at play here that I am not taking into account.
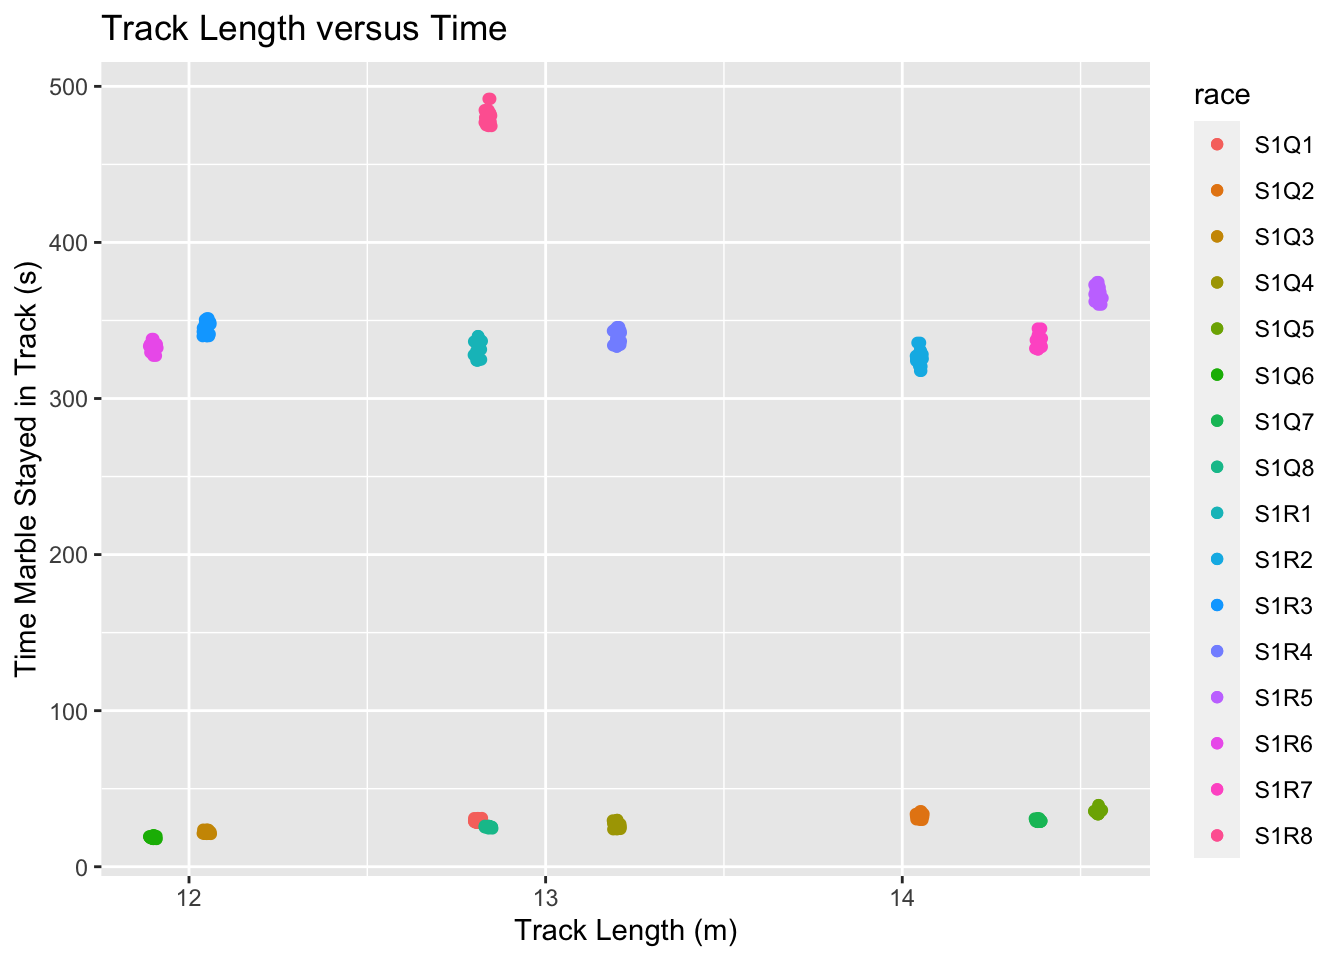
This scatterplot below shows the relationship between the track length and the time each marble stays in the track. It seems obvious that if the track is longer, the marble would stay on it for longer, but surprisingly there appears to be no relationship whatsoever between track length and time. It seems strange that some marbles have very short times while others have very long times, even when comparing within the same length track. It could be that the shape or steepness of the track is more strongly associated with the time than the length. Each colored cluster of points represents a different race with a different track for each race.
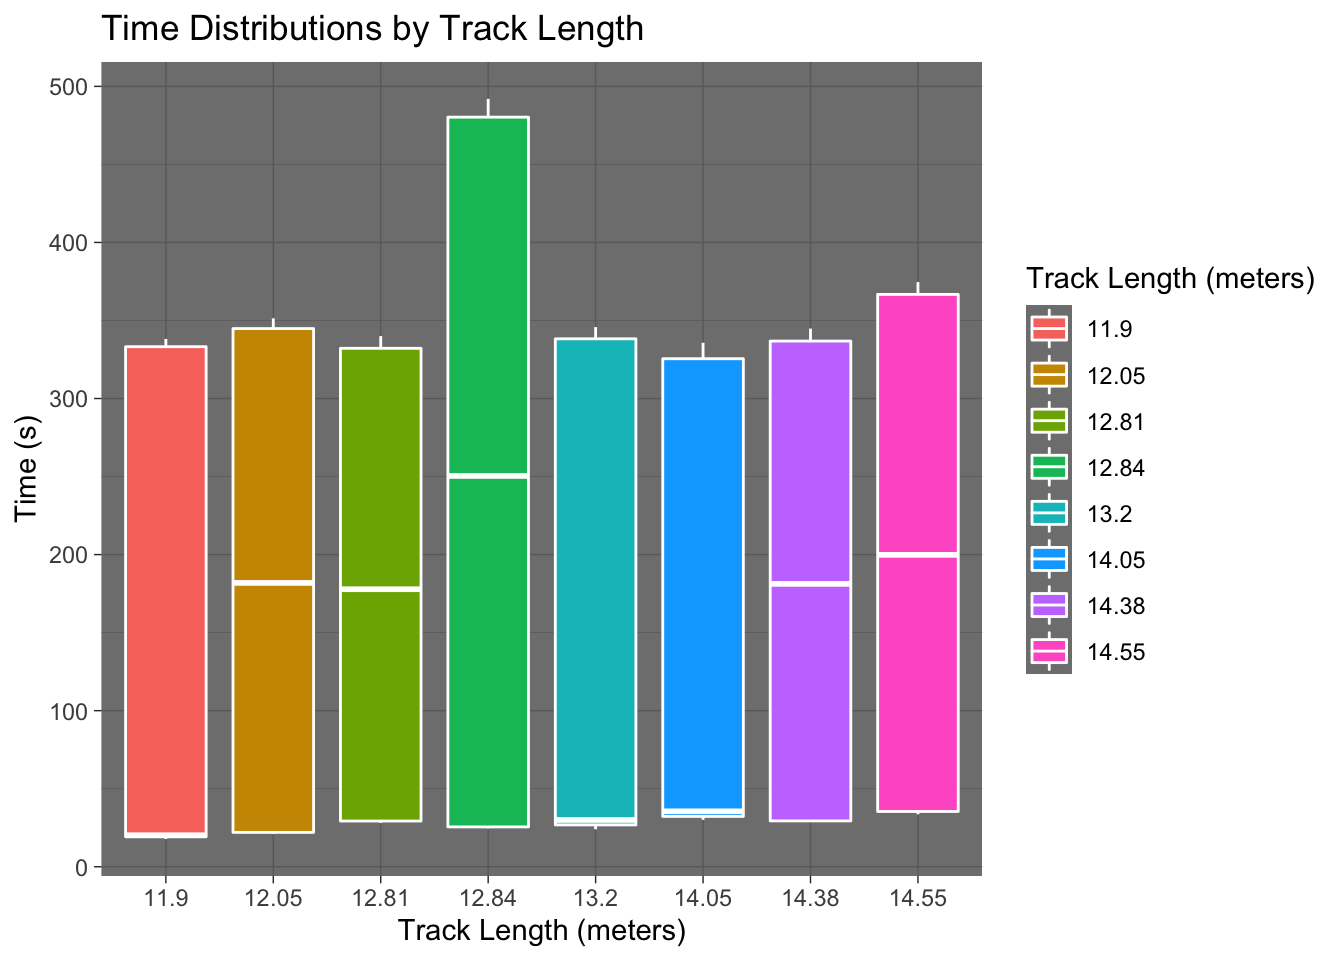
In order to represent this relationship in a little more detail, I have created boxplots below showing the distributions of times for each unique track length. Clearly, the distributions are all over the place, and there does not seem to be any relationship between track length and time.
Can one Team Really be Better than Another?
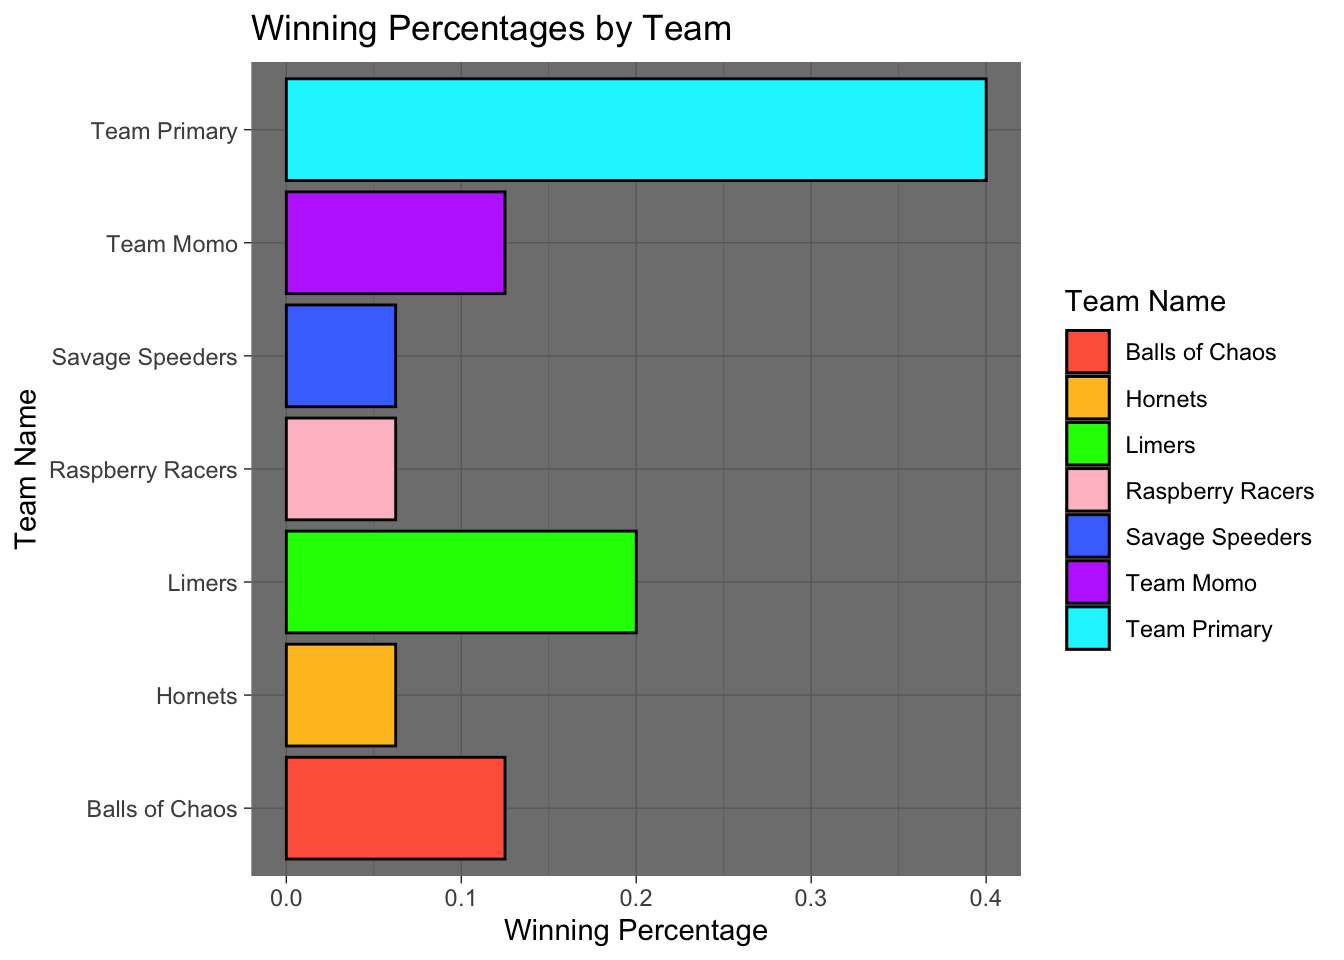
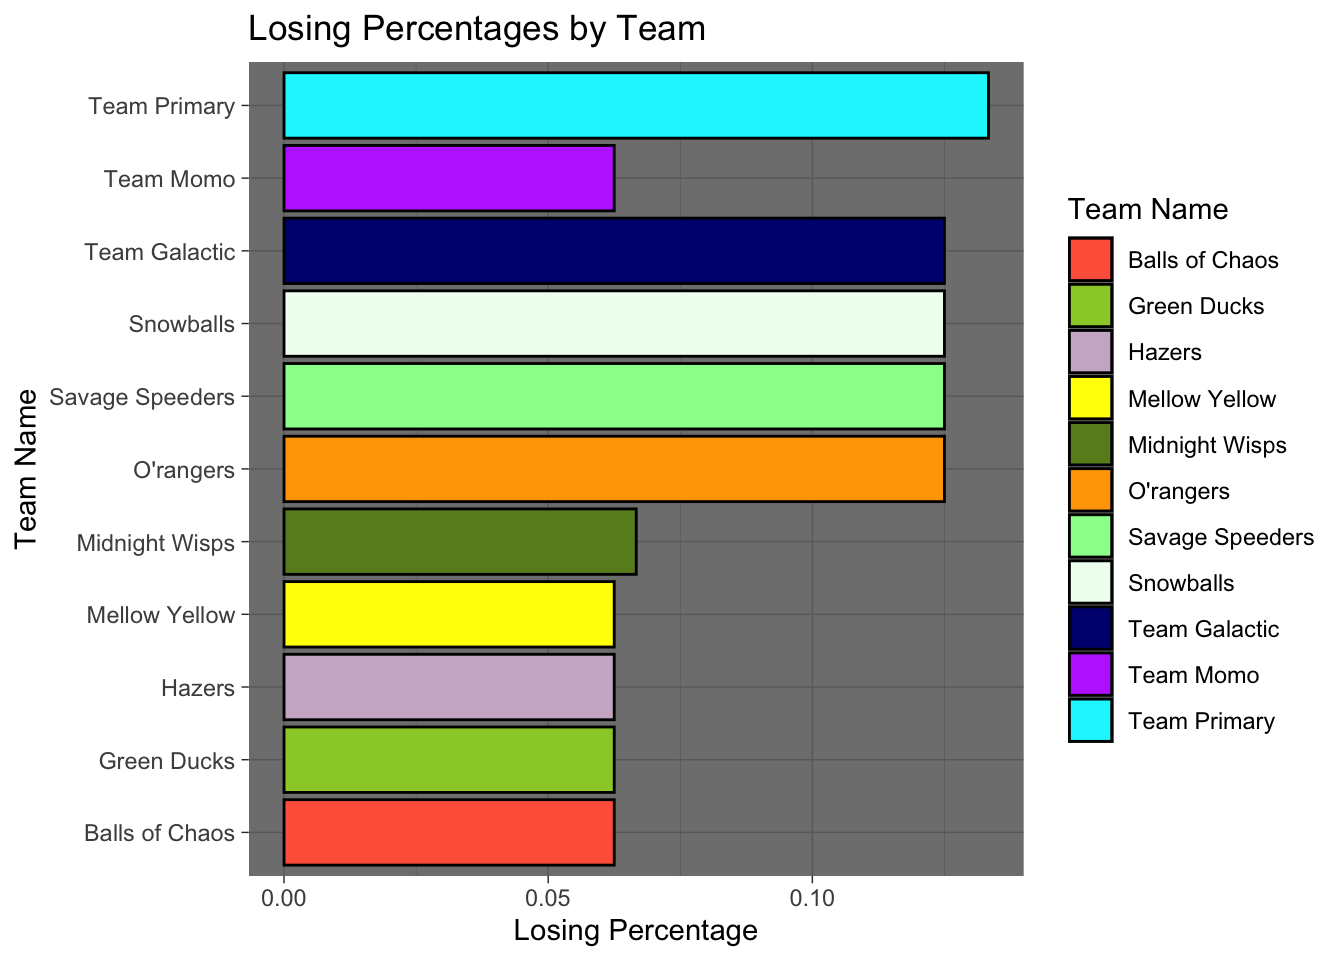
In order to analyze whether any particular team could truly do consistently well or consistently poorly compared to the other teams, I calculated the winning percentages (percentage of races where the team placed first) and losing percentages (percentage of races where the team placed last), and the results are shown in the barplots below. I have excluded teams whose winning/losing percentages were zero (i.e. they placed somewhere in the middle).
Surprisingly, the team that has the greatest percentage of wins by far, Team Primary, also has the highest percentage of loses, although not by as wide of a margin.
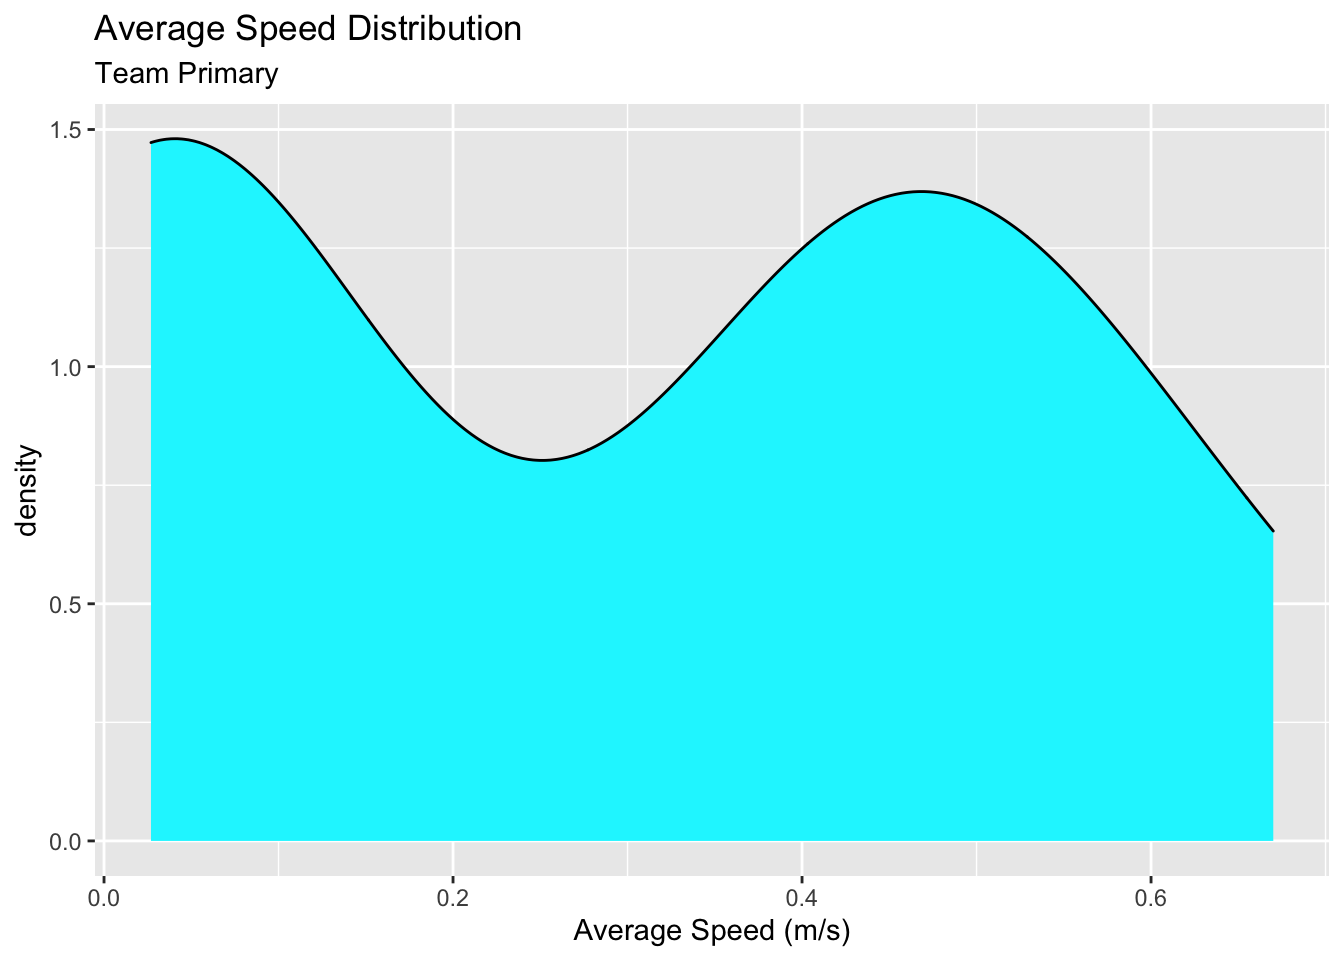
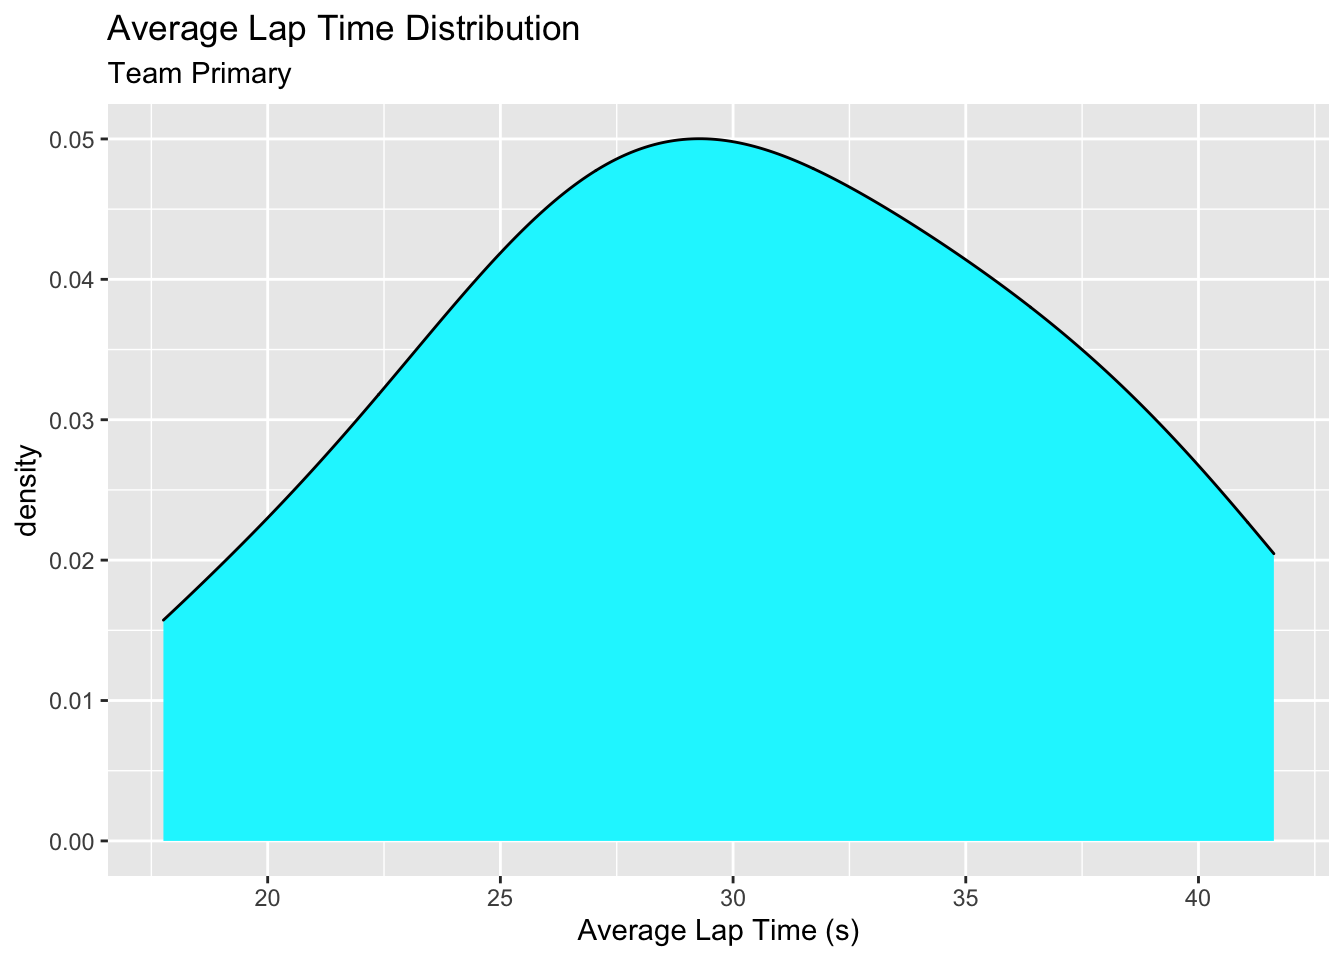
In order to analyze Team Primary’s actions more closely, I created two density plots below showing the distributions of speeds and lap times for this team.
Interestingly, the distribution for speed is bimodal, with some speeds very high and others very low. This is consistent with the fact that this team won a large percentage of races, but also lost a large percentage. However, it still leaves the question of why their outcomes were so polarized.
The blogpost referenced above by Randy Olson suggests that this inconsistency in performance may be the result of a consistently “high performing” marble being paired with a consistently “low performing” marble on the same team. It seemed to overwhelming to analyze each marble individually in the context of this blogpost, but this is an intriguing possible explanation that leads me to wonder how a specific marble could perform so consistently.
The distribution of lap times is also surprising. It is essentially a normal distribution with a mean of approximately 30 seconds. This suggests that Team Primary’s lap times remained relatively consistent despite the drastic variance in their overall times.
This analysis leaves me with several more questions that would require more extensive and detailed data. I am still curious about how and why certain marbles or teams consistently win or consistently lose, and why other marbles have more variable and seemingly random performances from race to race. I would be interested in analysing data about the angle at which the marbles are being dropped into the track, their initial speed, the order in which the marbles are dropped, and the shape, material, and density of the marbles (if there are differences). It could even be interesting to look in more detail about the people dropping each marble and analyzing factors such as how much practice they have had, and any strategies they might be using.
On the surface, marble racing may seem simple and mindless, but if we dig deep into the laws of physics governing the performance of the marbles, there is so much more to explore!
The code used to create this post is found here.