Background and Purpose
In honor of the week of Juneteenth, this week’s #TidyTuesday data contains information about the history of African-American slavery 2. Juneteenth (June 19th) is a holiday commemorating the day that a small subset of enslaved people in Texas, one of the last groups to hear the news, heard that they had been freed by the Emancipation Proclamation. Although freedom came little by little to different regions of the nation at different times and was not official until the 13th amendment was passed in December of 1965, the local blacks of the area in Texas decided on June 19th as their day of celebration, and the holiday gradually came to be recognized across the country 3.
This day represents a monumental event in U.S. history ending the horrific institution in which humans “owned” other humans and treated them as property, and yet this holiday does not receive the widespread observance that it deserves. You can read more about the importance of Juneteenth here 4and here 5, and you can sign the petition to make Juneteenth a national holiday here.
Of course Africans were not the only people to have been enslaved, and the indiginous people of the Americas as well as the many other enslaved peoples also deserve acknowledgement. However, this post will focus on the enslavement of Africans specifically.
Furthermore, numbers and graphs do not by any means tell the whole story of the cruelty of the slave trade and institution of slavery, and I encourage you to to educate yourself further. I will provide resources at the end of the post as a starting point. That being said, the purpose of this post is to highlight and recognize the vast numbers of individuals who were transported from their home countries and enslaved against their will. I hope that this will give you some perspective and allow you to imagine how enormous the impact of this institution was on the lives of millions of enslaved Africans as well as on the United States as a nation.
The data is from a few separate sources, and contains information about the number of voyages transporting enslaved persons between 1514 and 1866 and how many people were on each voyage, information about individual Africans who were freed during forced transport between 1808 and 1862, and information about the numbers of whites, free blacks, and enslaved blacks in the United States between 1790 and 1870 6 7.
Overview of Transport of Enslaved Persons Over Time
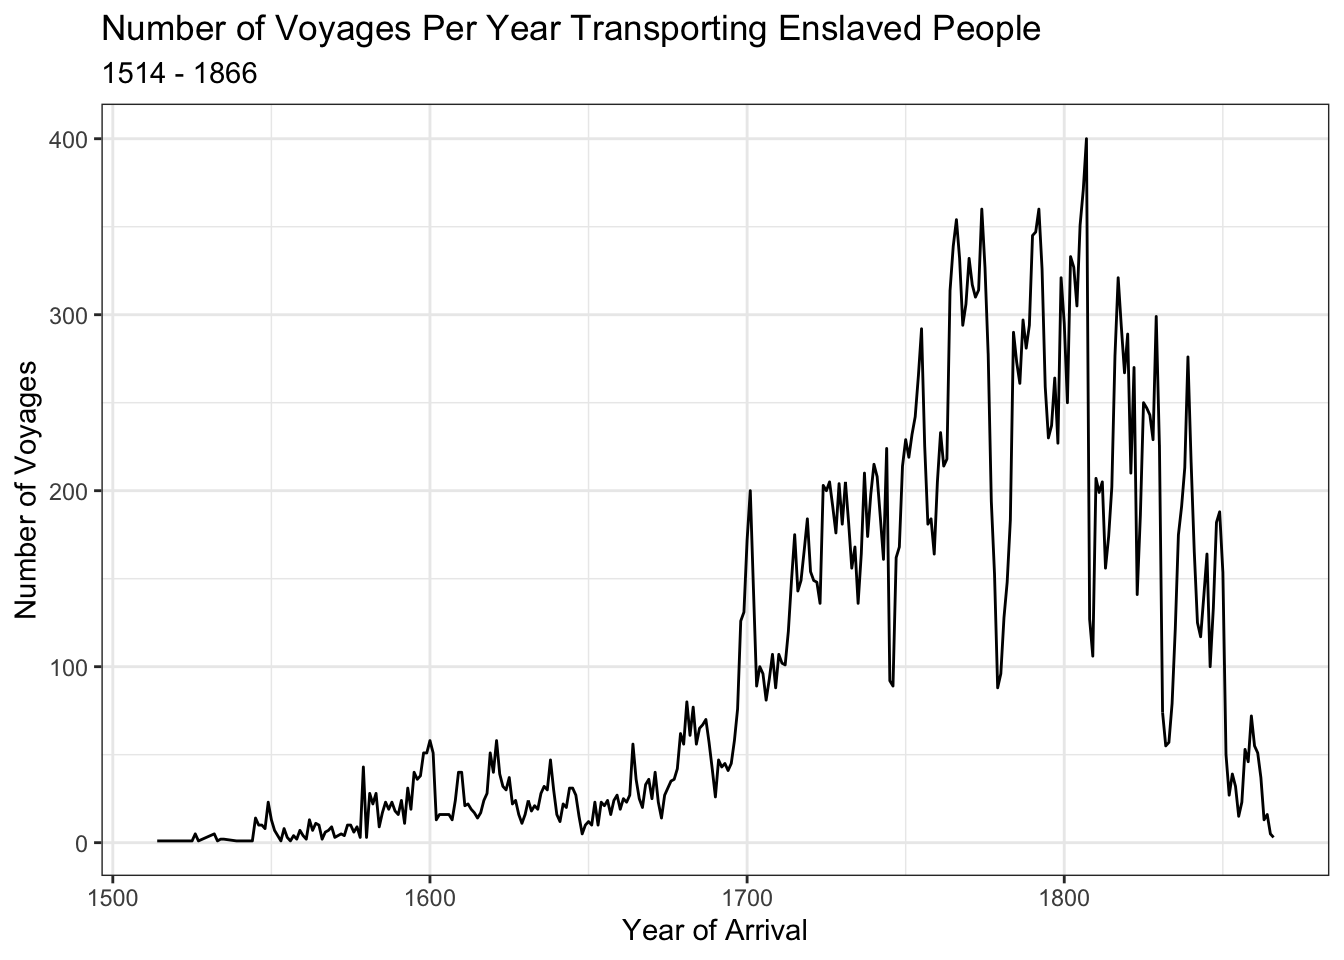
In order to give a broad overview, I have created a time series plot below showing the trends in the number of voyages transporting enslaved individuals per year between 1514 and 1866. We can see that the numbers steadily increase starting in 1514 at the beginning of the era of colonization and peak and then start to decline around 1808 when the slave trade was made illegal in the U.S. In total, 36,110 voyages were recorded in this data set.
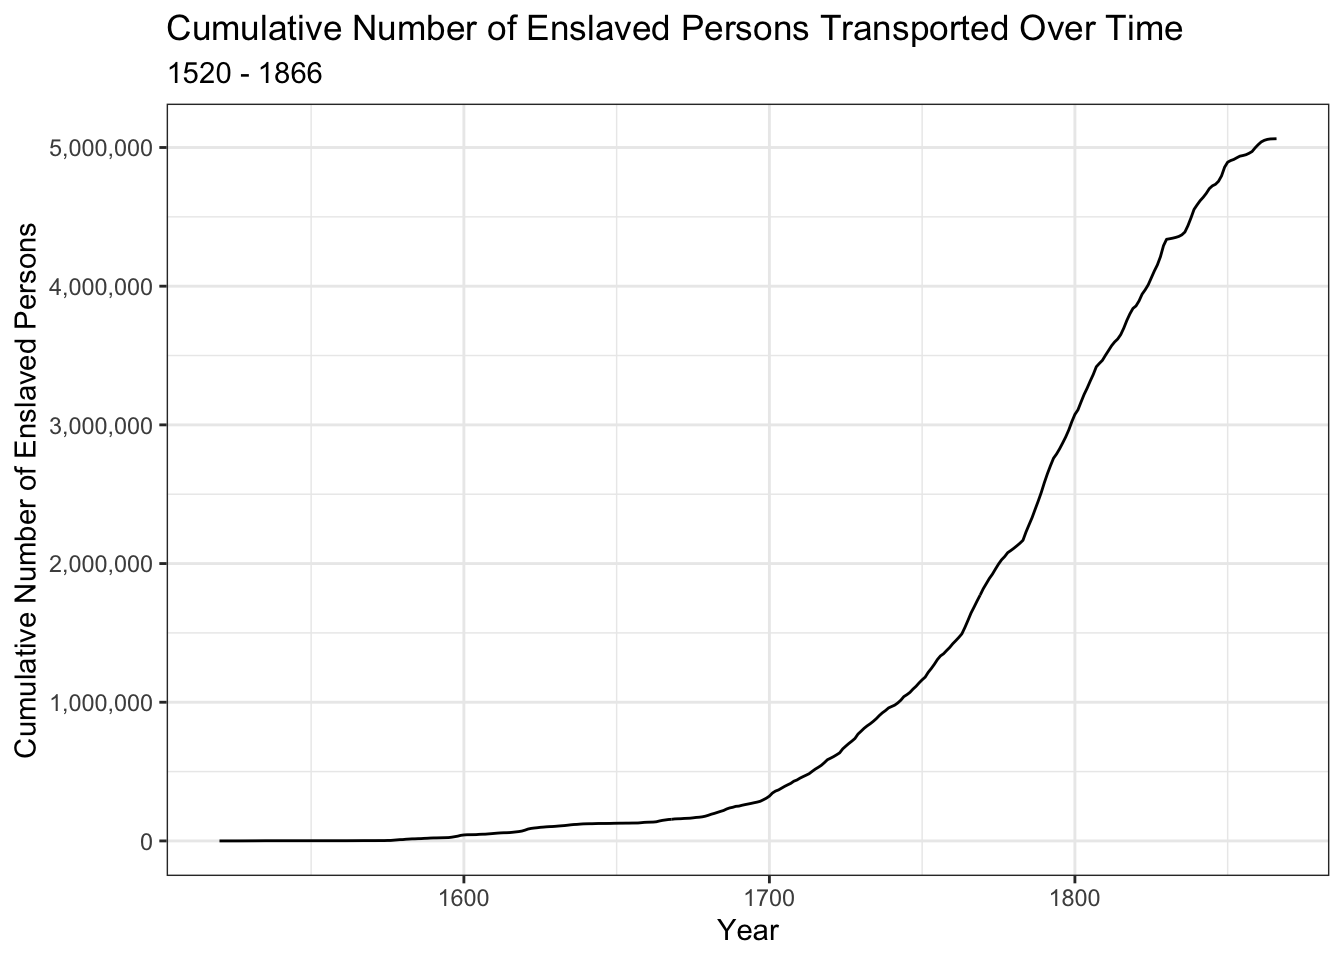
In order to emphasize the sheer number of individuals affected by the slave trade, I have created a plot below showing the cumulative number of individuals transported and forced into slavery over this time period. As the graph makes clear, over 5,000,000 individuals had been transported on slave ships by 1866. Furthermore, of the 36,110 voyages recorded, 17,746 of them have missing values for the number of individuals on the ship, so these observations are not included in the plot below. Therefore, there are likely many more individuals, possibly millions, who are not represented. We must also remember that the institution of slavery affected far more individuals than just those who were physically taken from their homes and enslaved– it also affected generations of individuals born into slavery as well as those who still face discrimination today as a result of this institution that formally ended over 100 years ago.
Analysis of African Persons Freed During Forced Transport 1808-1862
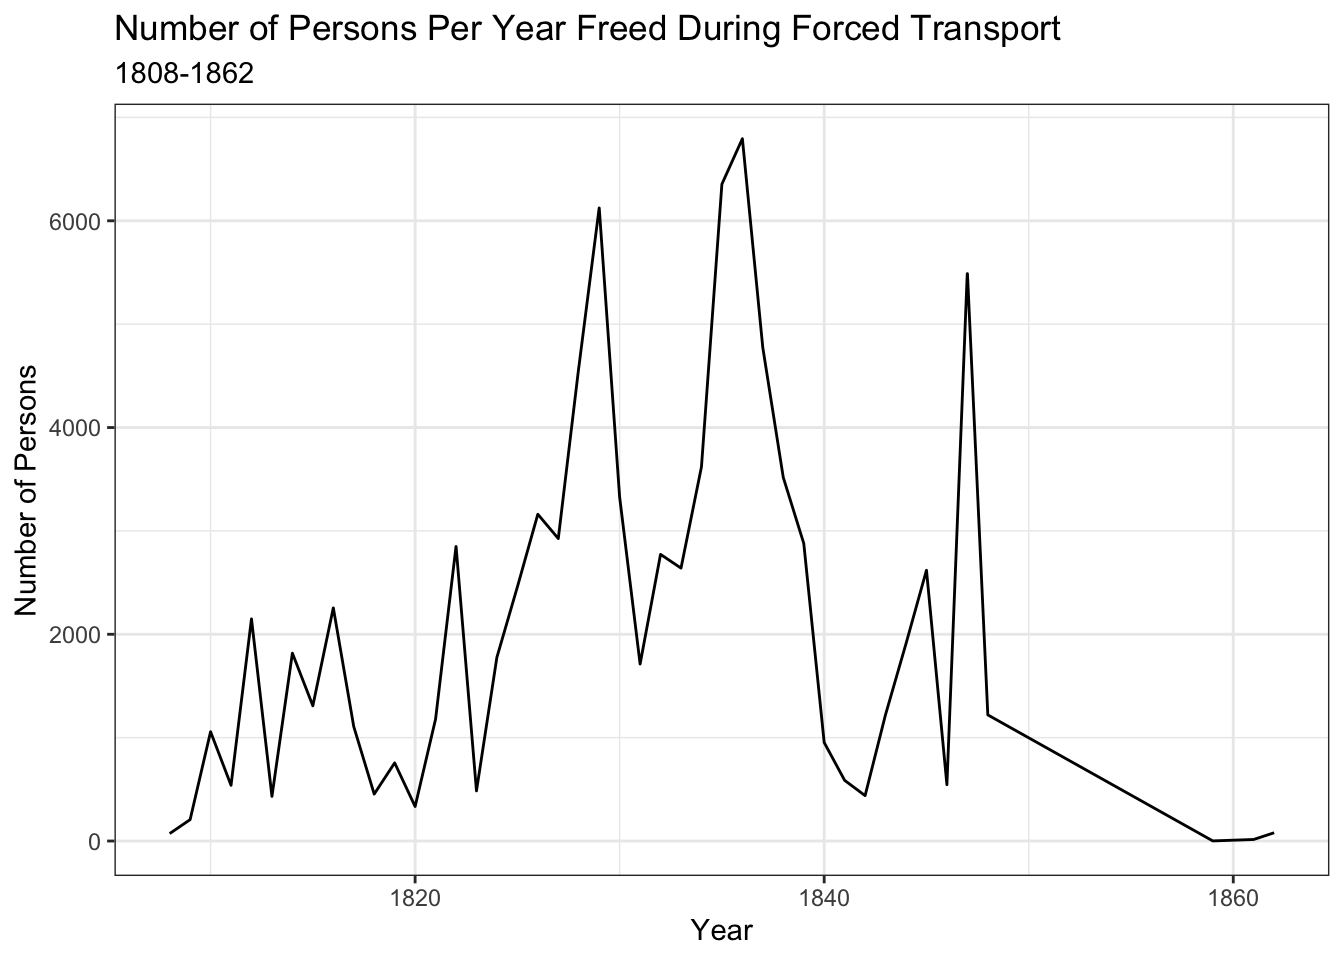
Even after the slave trade was outlawed in the U.S. in 1808, it continued for almost 60 more years. During this time, courts around the Atlantic basins intercepted several ships transporting enslaved people, freed the individuals, and recorded their names and some personal information about them.
The time series plot below shows the overall trends in the number of individuals freed per year over this time period. It appears from the graph that these interceptions were relatively sporadic and did not follow a clear pattern over time. A total of 91,490 recorded individuals were freed in this way over this time period.
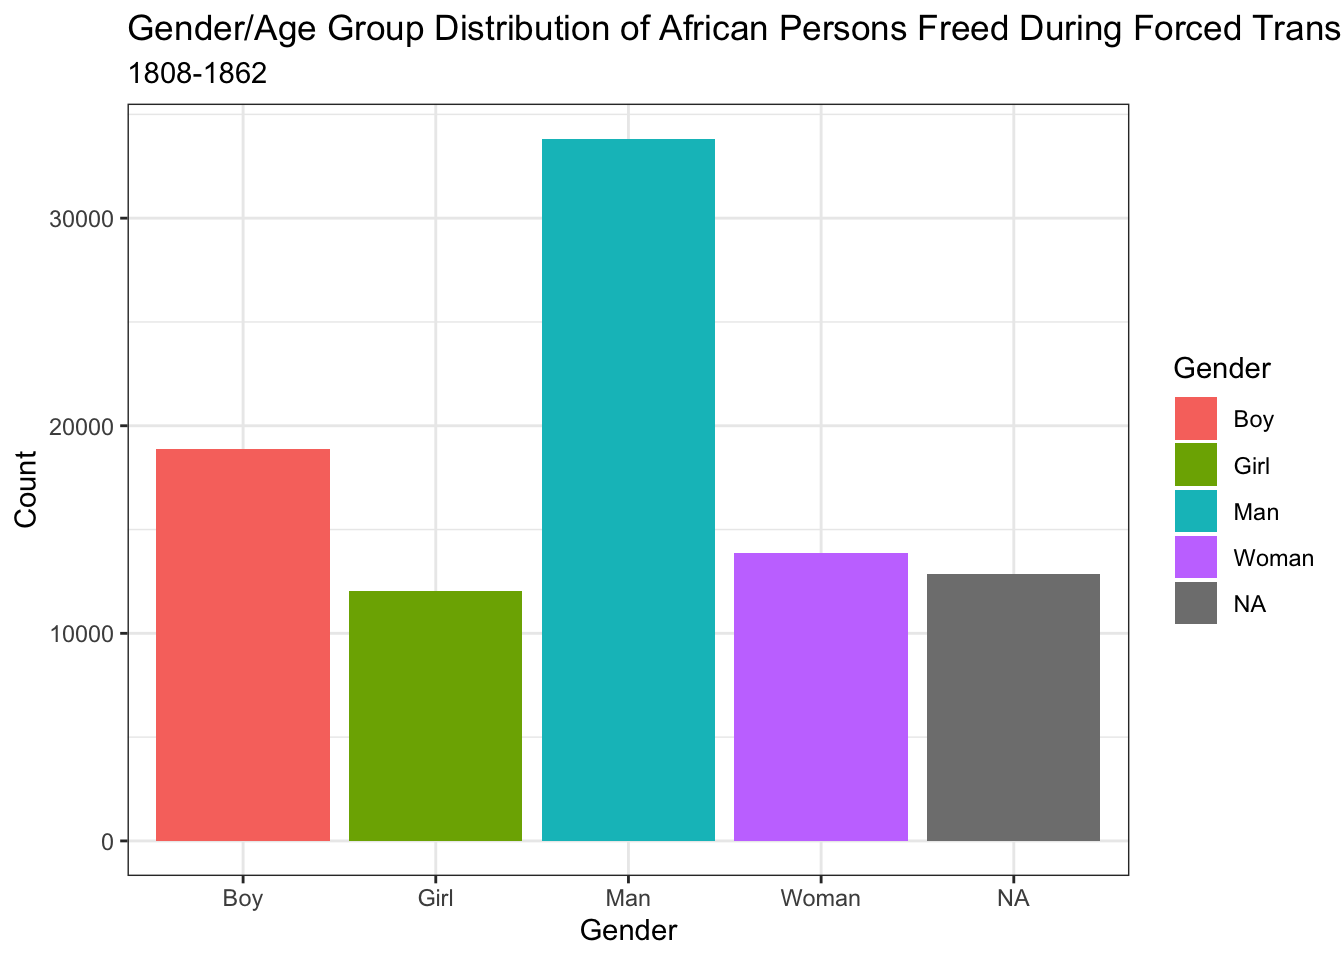
Gender/Age Group Distribution
The bar plot below analyzes the distribution of these freed individuals by gender and rough age group (child versus adult). It is clear that the majoriy of individuals freed were men, and this is likely because men were most sought-after as slaves, so they likely made up the majority of individuals on any given slave ship.
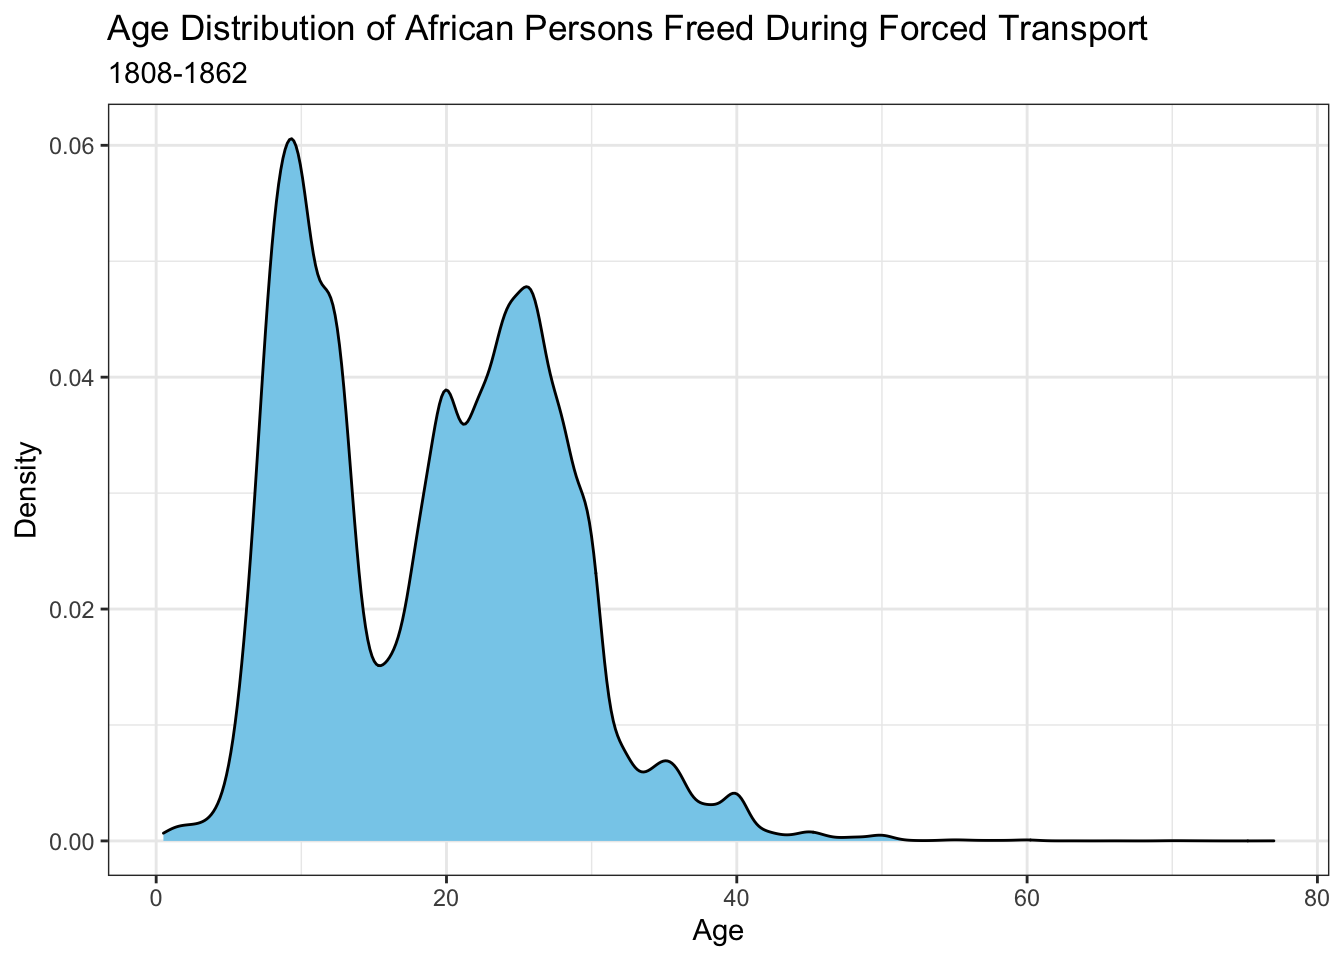
Age Distribution
The density plot below analyzes the age distribution of these freed individuals in more detail. Surprisingly, it appears that there was a large proportion of young children (around age 10-15) on these intercepted ships, and less surprisingly, a similarly large proportion of individuals in their 20s and 30s.
Composition of U.S. Population 1790-1870
Using the U.S. census data, I created a shiny app representing the composition of white, free black, and enslaved black individuals in different regions of the U.S. between 1790 and 1870 (link here) 8.
This period represents essentially the birth of the United States as an Independent Nation (Post-Revolutionary War) up until the end of the Civil War and the abolition of slavery (1865). I acknowledge that the composition of the nation was far more complex than what is represented by this data, and several racial/ethnic groups are not represented. And yet this visualization highlights whites and blacks in order to acknowledge the enormous numbers of enslaved persons during this time period and to represent the changes in these numbers in different regions over time.
By moving the year slider, we can see that as the white population grows over time, the population of enslaved blacks grows proportionally, especially in the South. In any given year, the ratio of enslaved blacks to whites appears to be about 1:2 in the South. In other words, enslaved blacks made up about 1/3 of the total population in the South during this time period. The number of enslaved individuals reached its peak of about 7,500,000 in the South in 1860, the last census count before emancipation. I am assuming this data is not counting the population of the Confederacy as part of the total U.S. population during the Civil War period because the graphs show that there are about 7,500,000 enslaved blacks in the South in 1860, and only about 3,000,000 in the entire United States.
In 1870, the graph makes it look as if the entire population of enslaved blacks (red bar) has magically become free blacks (green bar), which is technically what happened, as the 13th amendment officially freed all enslaved persons in 1865. However, we must remember that the transition to freedom was not that simple. Emancipation was a huge milestone in U.S. history and definitely a moment to celebrate with Juneteenth being this week. Yet we must remember that systems were put in place that essentially kept “freed” blacks in slavery for many years after emancipation, as blacks were given almost no support or resources to thrive in society. In fact, many whites were in support of a system to create a colony in Liberia to send away freed blacks during the 1800s, signalling that blacks were not welcome or respected in American Society.
To this day, our society relies on institutions rooted in oppression and white supremacy, and over 100 years after emancipation, black Americans still suffer from the legacy of slavery in the form of disproportionate police brutality, mass incarceration, poverty, and discrimination in employment, healthcare, and almost every facet of society.
The code used to generate the shiny app is found here.
Additional Resources
Here is a list of additional resources to learn more about how slavery still affects American society today and why it is important that every American have a solid understanding of this essential component of our past:
African-American History Timeline
Resource about teaching slavery in schools
Teaching Tolerance Educational Videos
All resources compiled from the TidyTuesday github page.
Where to Donate
If you are able and willing to contribute to the cause of educating people about African-American history and the history of slavery, an understanding of which is essential to our understanding of the racism that still persists in the U.S., here are a couple of organizations committed to providing educational resources about these topics:
The code used to generate this post is found here.
https://www.wifr.com/content/news/Stateline-Junet-511548891.html↩︎
https://github.com/rfordatascience/tidytuesday/blob/master/data/2020/2020-06-16/readme.md↩︎
https://www.blackpast.org/african-american-history/juneteenth-birth-african-american-holiday-2/↩︎
https://www.blackpast.org/african-american-history/juneteenth-birth-african-american-holiday-2/↩︎
https://www.vox.com/identities/2018/6/19/17476482/juneteenth-holiday-emancipation-african-american-celebration-history↩︎
https://www.census.gov/content/dam/Census/library/working-papers/2002/demo/POP-twps0056.pdf↩︎