This week’s #TidyTuesday data contains information about the professional ratings (on a 0-100 scale) of many varieties of coffee from around the world 2 3. The overall score for each variety is recorded along with sub-scores specifically rating various qualities of the coffee including aroma, flavor, aftertaste, acidity, body, balance, uniformity, sweetness, and moisture (1-10 scale). The species of the coffee, either Arabica or Robusta, is also recorded. This week, instead of using visualizations, I have taken a slightly different approach to this data.
In this post, I analyze the association between each sub-score and the overall score as well as the association between the species and the overall score using a multiple linear regression model.
Model Summary
A model with overall score as the response and each sub-score along with species as the explanatory variables shows a significant relationship between each subscore and the overall score (p < 0.05). The only coefficient that is insignificant is species. For most of the subscores, the coefficients are close to one indicating that on average, adjusting for each of the other variables, for each one point increase in the sub-score, the overall score increases by one point. Flavor has the largest positive coefficient value (1.4) indicating that an increase in the flavor score has a larger influence on the overall score than do the other sub-scores on average. The correlation matrix also shows that of all of the explanatory variables, flavor score has the strongest correlation with overall score (r = 0.874).
The one sub-score that does not fit the pattern is moisture. Oddly, the model predicts that for every 1 point increase in the moisture score, the overall score will decrease by 0.379 points on average, adjusting for the other explanatory variables.
Although the coefficient is not significant, the coefficient for species indicates that adjusting for each sub-score, the Robusta coffees scored slightly higher on average than the Arabica coffees.
It is possible that there are colinearity issues making this model inaccurate, as some of the sub-scores have relatively strong correlations with each other (the highest is around 0.85) as shown by a correlation matrix. Additionally, the the sub-scores do add up to create the overall score, so I’m not sure if this causes an issue for the model.
Overall, this model using these predictor variables accounts for about 99.4% of the variation in overall scores (R-squared = 0.994), which makes sense because it includes each component of the overall score.
The full model summary output is shown below.
##
## Call:
## lm(formula = total_cup_points ~ aroma + flavor + aftertaste +
##     acidity + body + balance + uniformity + clean_cup + sweetness +
##     moisture + species, data = coffee_ratings)
##
## Residuals:
##      Min       1Q   Median       3Q      Max
## -2.58341 -0.10456 -0.00720  0.07886  2.94557
##
## Coefficients:
##                Estimate Std. Error t value Pr(>|t|)
## (Intercept)    -0.13904    0.19476  -0.714   0.4754
## aroma           1.05782    0.03512  30.124   <2e-16 ***
## flavor          1.40884    0.04958  28.417   <2e-16 ***
## aftertaste      1.29978    0.04569  28.447   <2e-16 ***
## acidity         1.07453    0.03640  29.516   <2e-16 ***
## body            0.98649    0.03375  29.233   <2e-16 ***
## balance         1.17843    0.03522  33.464   <2e-16 ***
## uniformity      1.00916    0.01738  58.048   <2e-16 ***
## clean_cup       1.02449    0.01250  81.965   <2e-16 ***
## sweetness       0.98082    0.01802  54.426   <2e-16 ***
## moisture       -0.37881    0.15905  -2.382   0.0174 *
## speciesRobusta  0.09310    0.06634   1.403   0.1608
## ---
## Signif. codes:  0 '***' 0.001 '**' 0.01 '*' 0.05 '.' 0.1 ' ' 1
##
## Residual standard error: 0.2715 on 1327 degrees of freedom
## Multiple R-squared:  0.994,  Adjusted R-squared:  0.994
## F-statistic: 2.01e+04 on 11 and 1327 DF,  p-value: < 2.2e-16
Regression Assumptions
In order to check the validity of this model for making predictions, I have tested the regression assumptions below:
- Linearity
- Constant Variance
- Normality of Residuals
- Randomness
- Independence
I am not certain that this is a random sample, so randomness could be violated. Independence is reasonable because the rating of one type of coffee would not be likely to influence the rating of a different type.
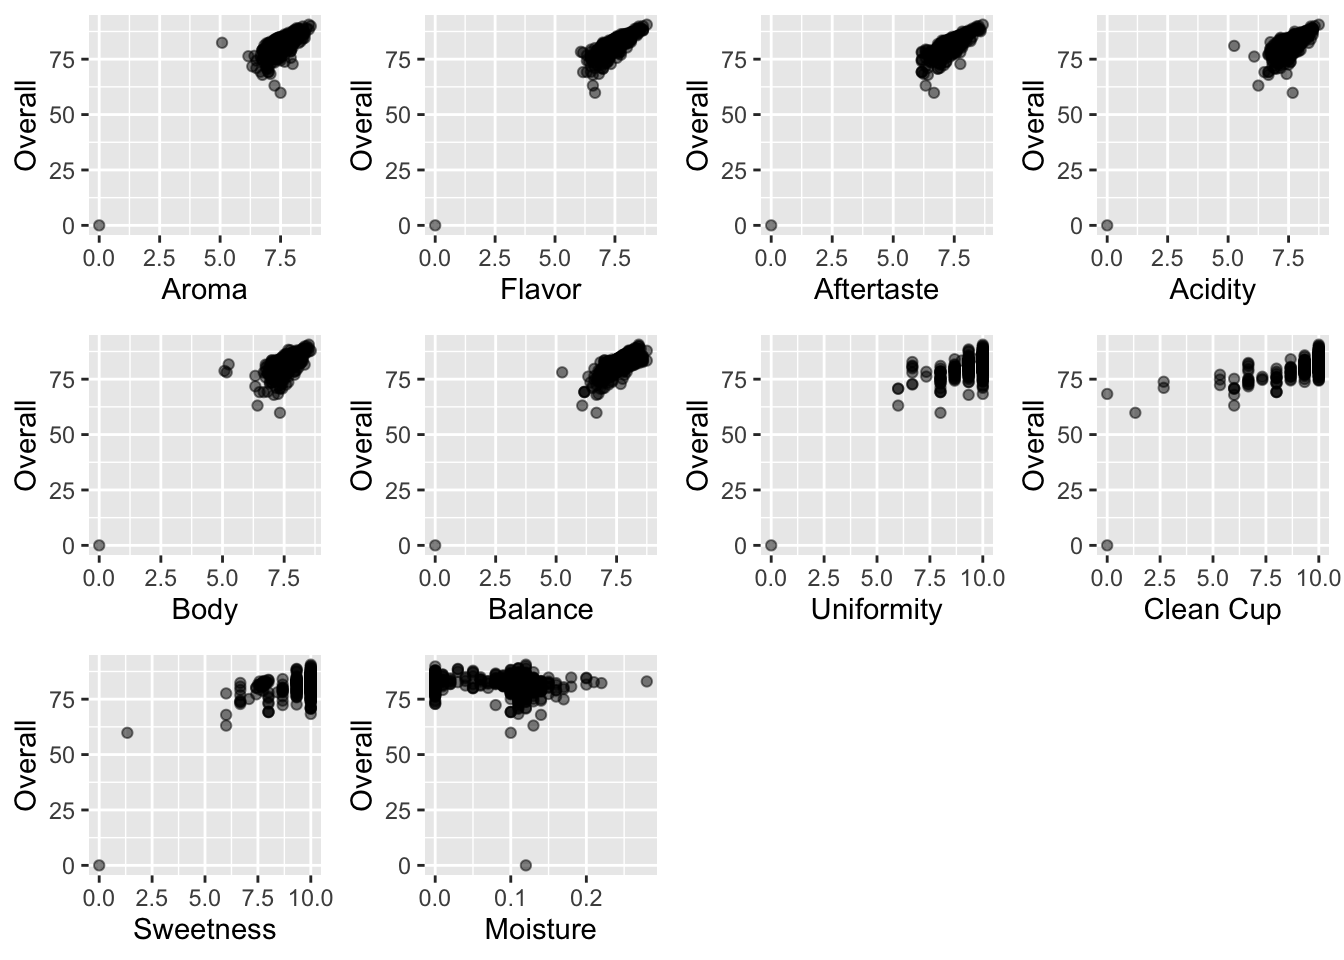
In order to check the linearity assumption, I have made scatter plots below with each sub-score on the x-axis and overall score on the y-axis. Most of the relationships appear approximately linear. The clean cup and sweetness scores do look like they could be slightly curved, and it is difficult to tell because there are so few points with very low scores. For most of the subscores, most of the points are clustered at the upper right corner, indicating that most coffees had relatively high scores and sub-scores. As shown by the coefficients of the model, there is a clear positive relationship between each sub-score and the overall score with the exception of the moisture category.
Relationships Between Sub-score and Overall Score
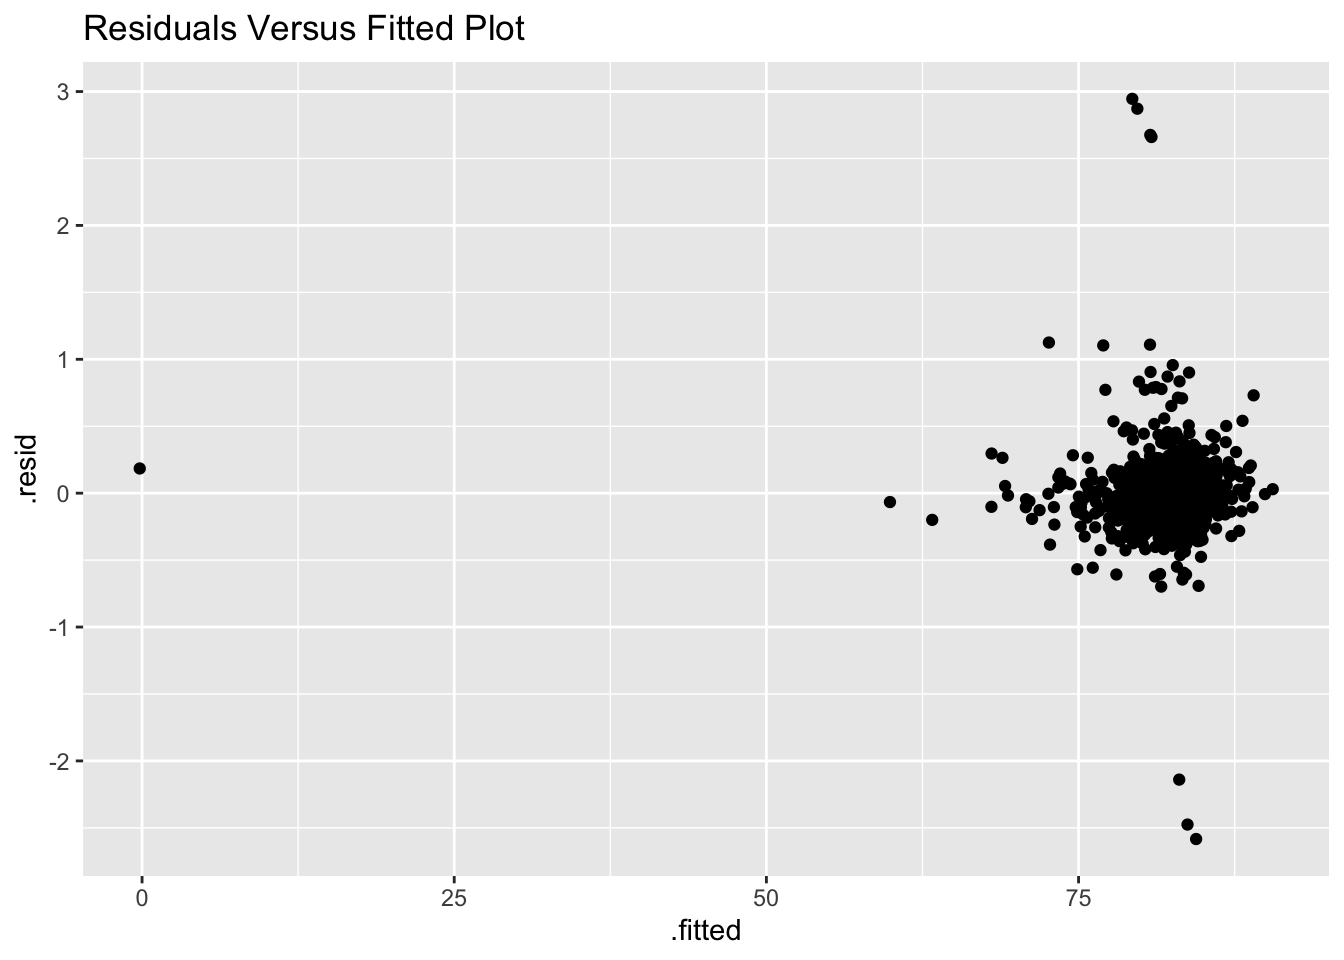
In order to test the constant variance assumption, I have generated a residuals versus fitted values plot below. Although most of the points are clustered at the upper end, they do not show a clear pattern, so the constant variance condition is met.
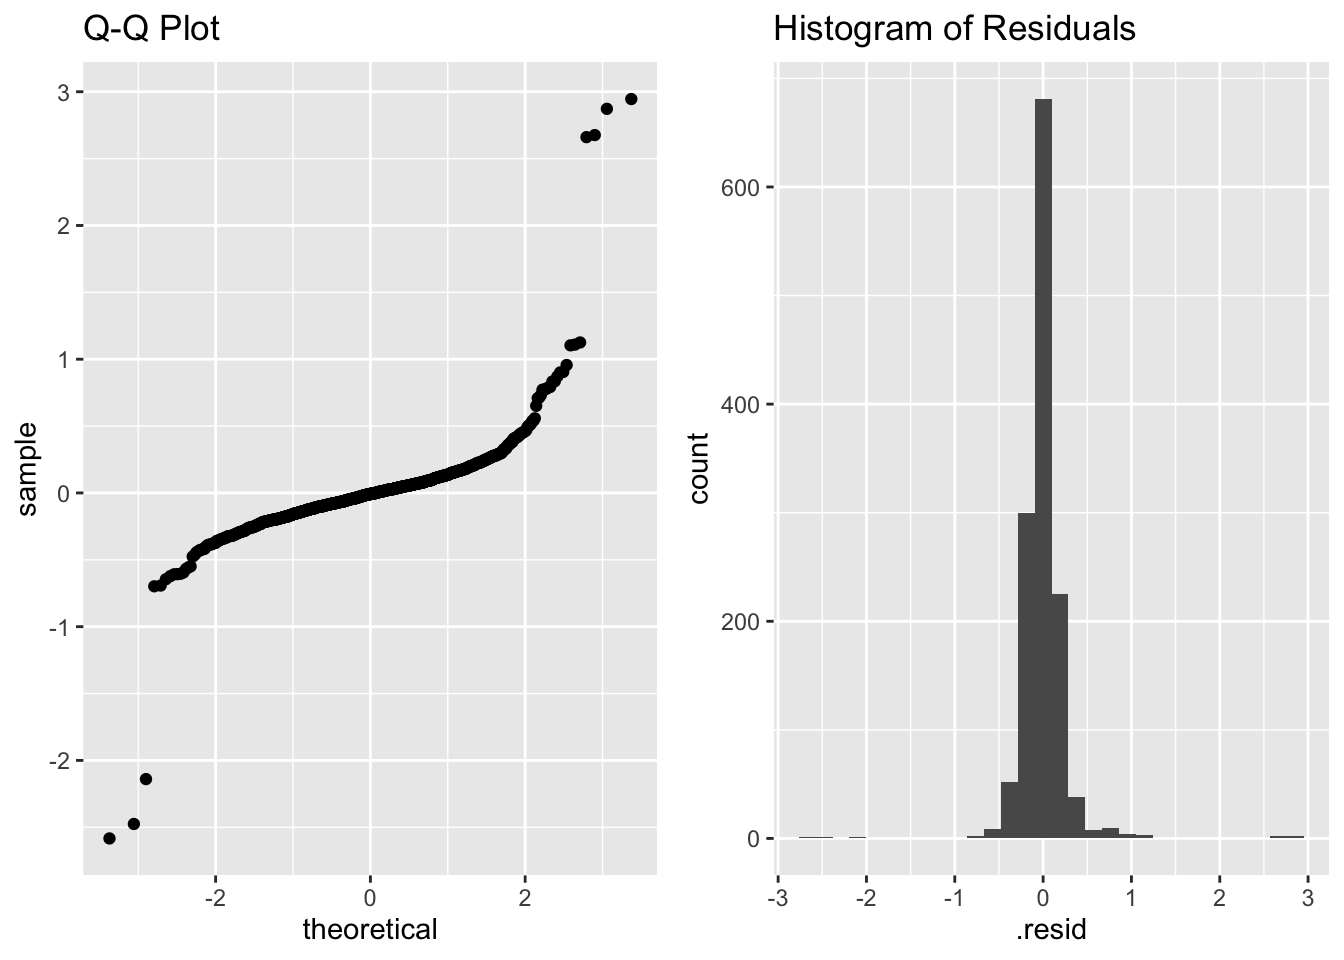
In order to check the normality assumption, I have created a Normal Q-Q plot and a histogram of the residuals below. The normality assumption is questionable, as the Q-Q Plot is clearly curved (a straight line indicates normality), and the histogram of residuals does not quite approximate a normal distribution.
Overall, although the normality assumption is violated, this model can still be useful to analyze the relationships between each sub-score and the overall score. I was surprised at how similar the patterns were when looking at each sub-score in relation to the overall score in the scatter plots, with the exception of the moisture category. There are so many more intriguing questions to dive into using this data as well. Check out this article on the top coffee-producting countries and this article on where in the world to find the best coffee to see more creative ways to analyze this data.
The code used to generate this post is found here.