
This week’s #TidyTuesday data contains information about space missions between 1961 and 2020 2 3. For each mission, it contains information about the mission itself such as the launch year as well as information about the astronaut including sex, birth year, nationality, and the total number of missions completed.
I start with an overview using time series plots to show the cumulative number of missions and hours of space travel since 1961 by sex. I then delve deeper into the demographics of the astronauts by exploring age distributions, sex, and the relationship between the age of an astronaut’s first mission and how many total missions they complete. The data represents worldwide space travel, but for certain specified analyses I extract only astronauts from the U.S.
Overview of Space Travel Over Time
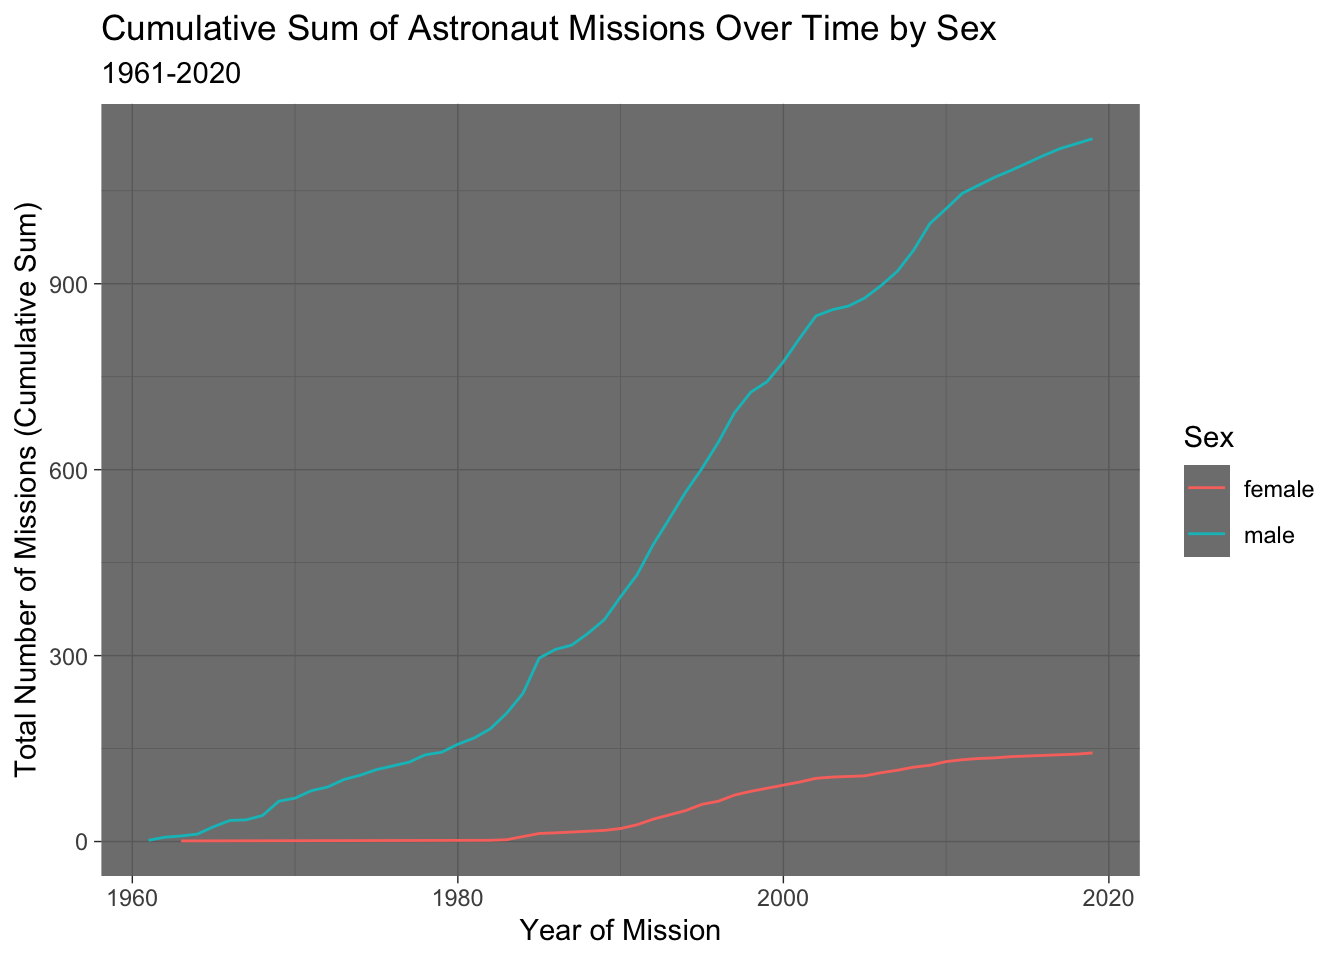
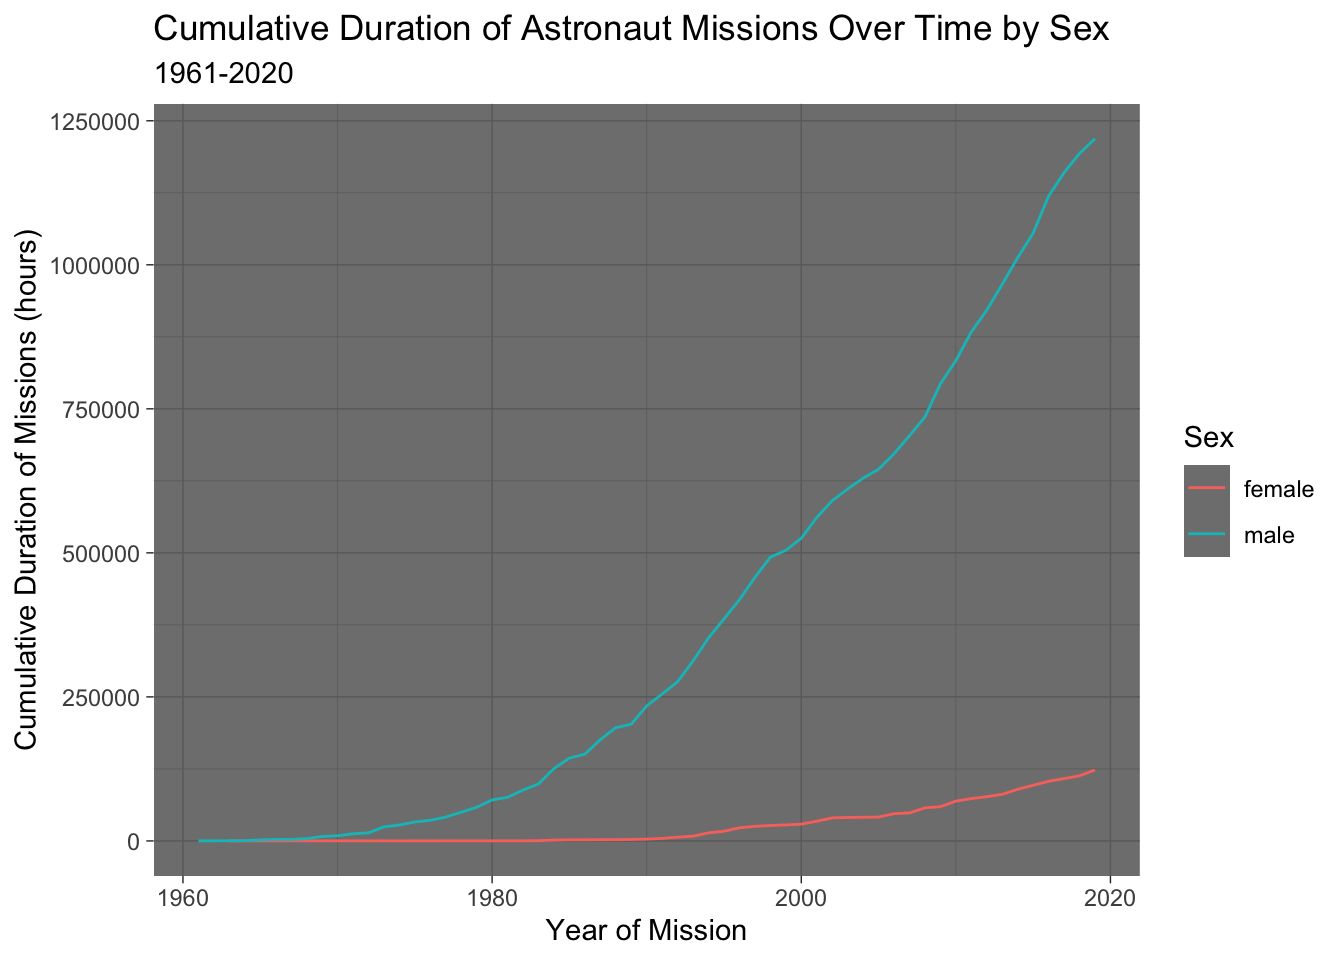
In order to visualize the overall trends in space travel by sex over time, I have created two time series plots below representing the total number of missions (first plot) and the total number of hours spent in space travel (second plot) since 1961. By the beginning of 2020, there had been 1,277 space missions (1,134 by men and 143 by women) adding up to a total of 1,341,979 hours of (recorded) space travel worldwide! That’s over 153 years (counting missions running at the same time each separately)! Clearly, however, women are extremely underrepresented in this field. Even in 2019, there remains an enormous gap between the number of missions completed by female astronauts and the number completed by males.
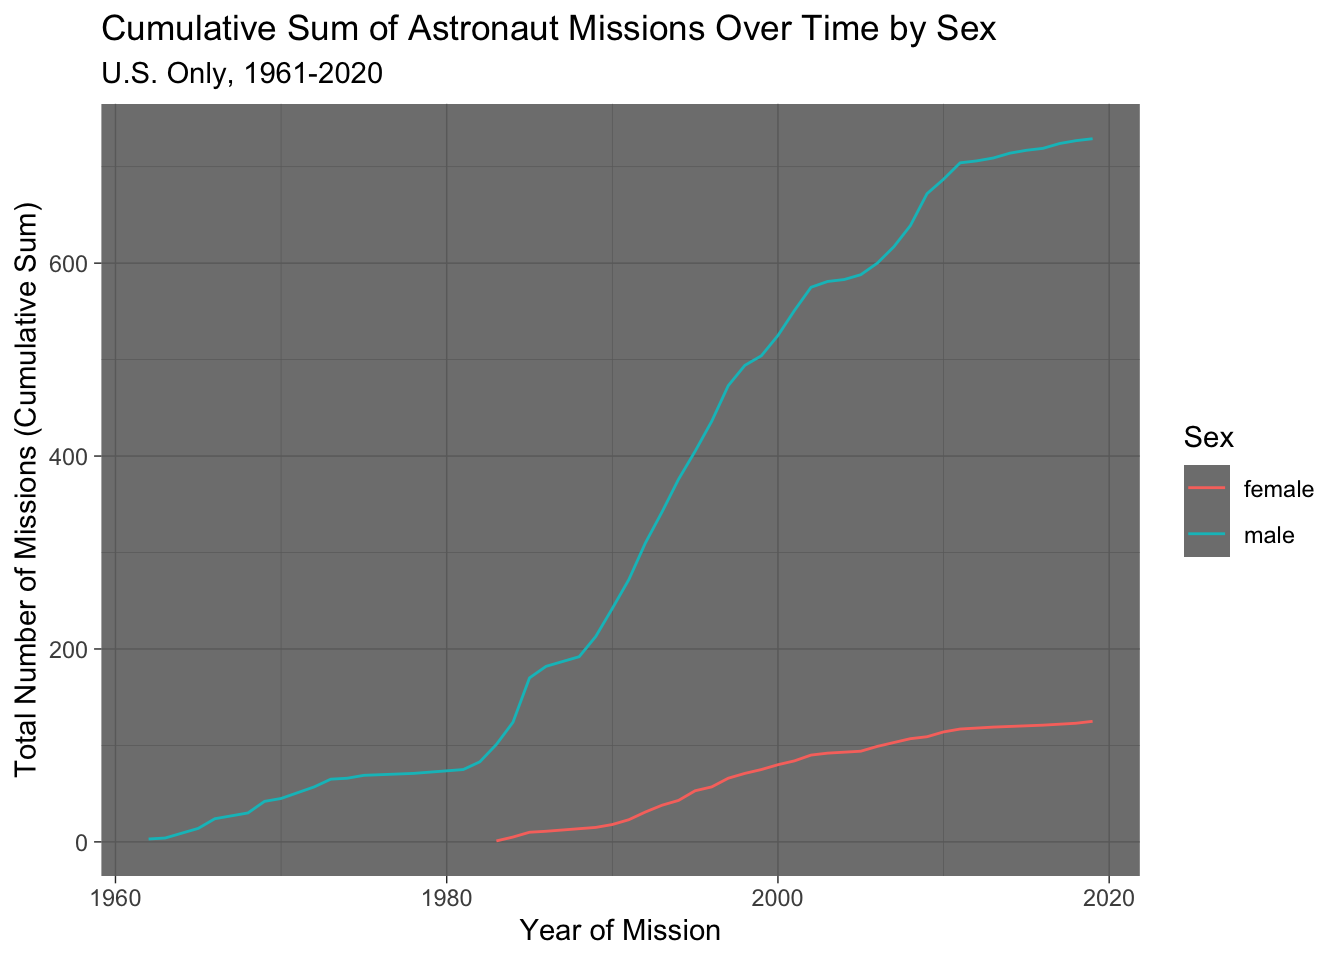
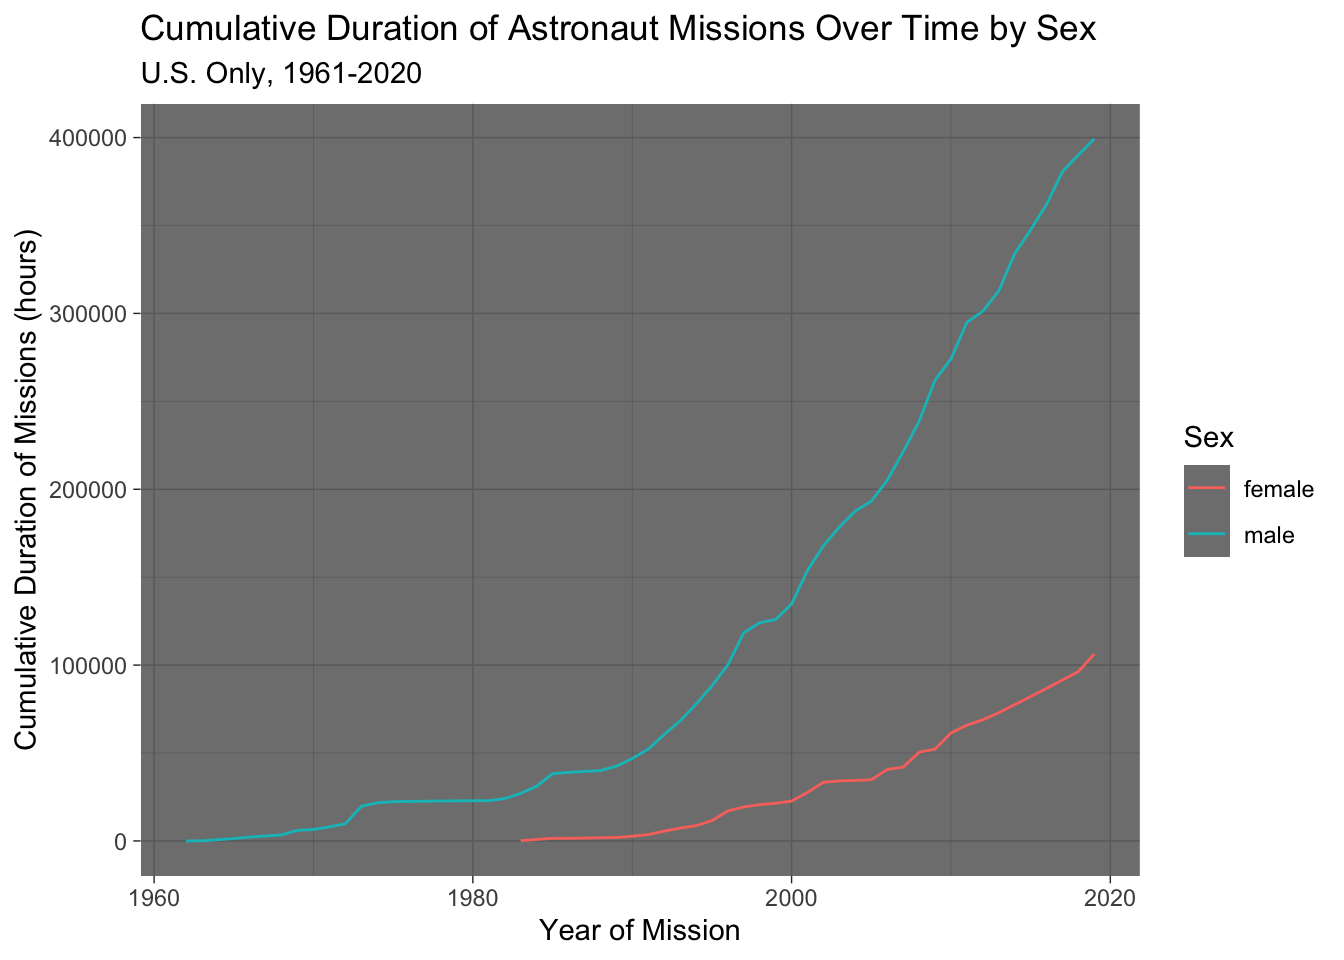
 Below, I have reproduced the same two time series plots limiting the missions to only those completed by astronauts from the U.S. The trends are similar to the worldwide trends, although it is notable that no space missions were taken by women from the U.S. until 1983. The first woman from the U.S. to go on a space travel mission was Sally K. Ride. Ride was a physics professor and also the youngest American astronaut to have traveled to space 4. The only two women to have engaged in space travel missions before Sally Ride were Valentina Tereshkova (1963) and and Svetlana Savitskaya (1982), both of the U.S.S.R.
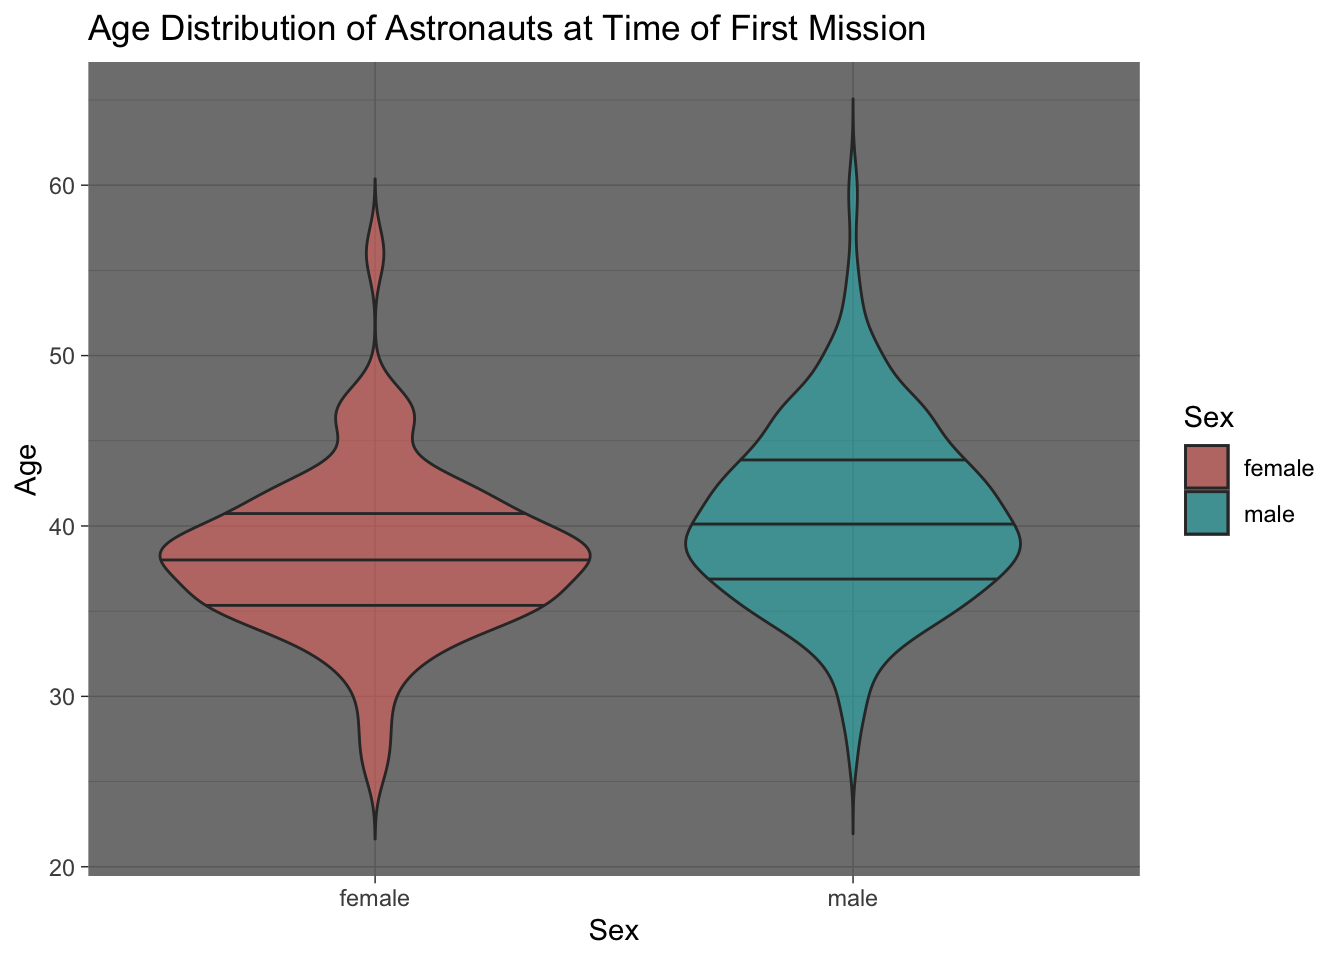
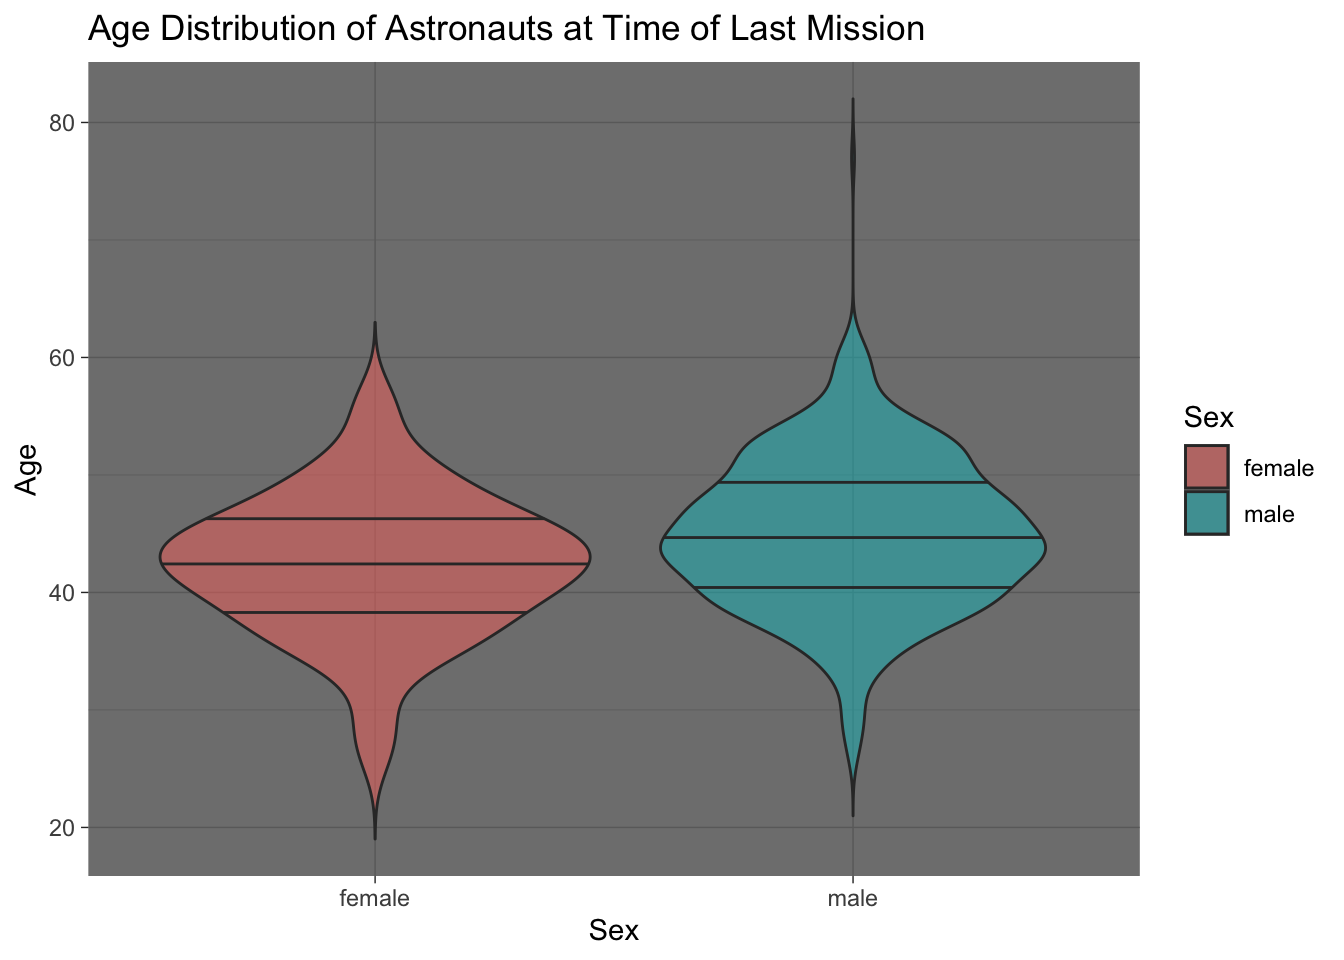
Age Distributions of Astronauts
To visualize the age distributions of astronauts, I have created two violin plots below showing the age distributions by sex for astronauts embarking on their first space travel mission (first plot) and their last space travel mission (second plot). The lines represent the first, second (median) and third quartiles.
Not surprisingly, the median ages for astronauts on their last mission are slightly higher than for those on their first for both sexes. Also, the median age for women is slightly lower than that for men in both plots. There is some duplication in the cases of astronauts who only participated in one mission. All distributions appear to be relatively normal, although there is a very wide range of ages for both sexes.
Notably, John Glen was the oldest astronaut to fly in space, having participated in his last space travel mission at age 77. He is also known for being the first American to orbit the Earth (1962), the fifth person and third American in space, and an Ohio Democratic senator of 24 years (1974-1999) 5.
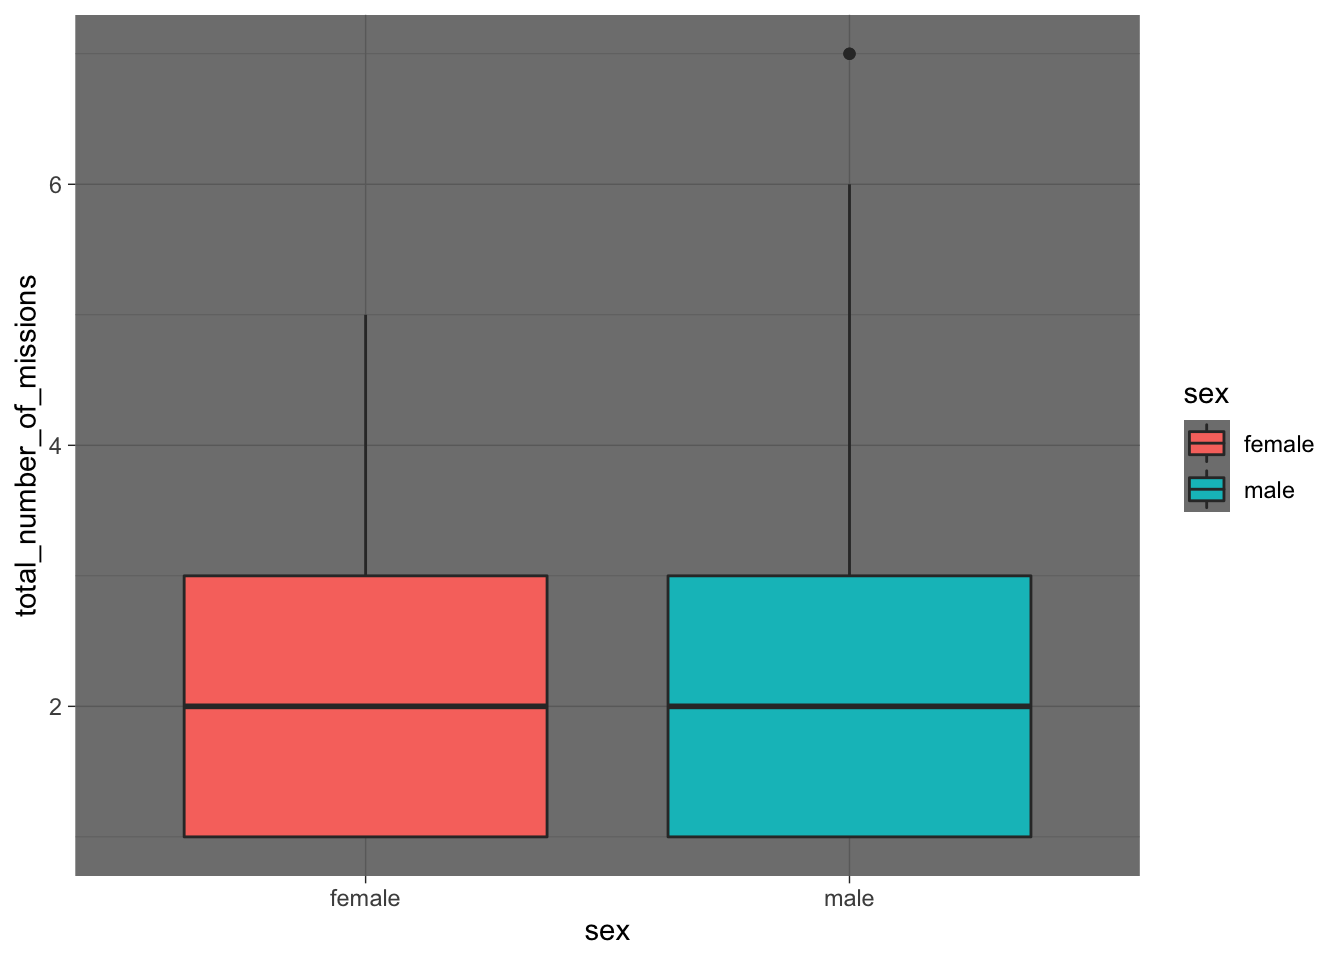
Number of Missions by Sex
The boxplot below visualizes the distributions of number of space missions completed (per astronaut) by sex. Surprisingly, the median number of missions seems to be around 2 for both males and females. I would have predicted that the number of missions per astronaut would have been significantly higher for males based on the previous patterns.
Relationship Between Age at First Mission and Total Number of Missions
The interactive scatterplot below shows the relationship between the age of an astronaut on their first mission and the total number of missions on which they would eventually participate. There is a clear negative association between these two variables, although there is a very wide age range for those who only participated in one mission. Hover over a point to see more information about any particular astronaut.
Since the scatter plot for all astronauts worldwide is very densely packed with points, I have created a separate plot below highlighting only American astronauts.
Overall, the patterns show that women have been extremely underrepresented among astronauts since space travel became possible. Thus, we must make it a priority to increase gender/sex diversity in this field.
The code used to generate this post is found here.
https://pixabay.com/photos/astronaut-space-nasa-galaxy-5080937/↩︎
https://github.com/rfordatascience/tidytuesday/blob/master/data/2020/2020-07-14/readme.md↩︎
Stavnichuk, Mariya; Corlett, Tatsuya (2020), “Astronaut database”, Mendeley Data, v1 http://dx.doi.org/10.17632/86tsnnbv2w.1↩︎